Discover
 Help Centre
 Status
 Company
 Careers
 Press
PressDaily market update: Bitcoin breaches $19,000 ?

The momentum in the crypto market continues to look strong. Bitcoin breached $19,000 yesterday for the first time since December 2017, and most altcoins are pumping massively. Will it last? Is this just the beginning?
As always, here’s your daily market update to help you on your way. If you’re new to the world of crypto, take a look through our beginner’s guide to crypto trading series to help make sense of all these indicators, including in-depth explorations of common strategies, market analysis techniques, and more.
The content of this article is for information purposes only and is not investment advice or any form of recommendation or invitation. Luno always advises you to obtain your own independent financial advice before investing or trading in cryptocurrency.
All information is correct as of 08.00am GMT.
Bitcoin price
We closed yesterday, 24 November, 2020, at a price of $19,107.46 – up from $18,364.12 the day before. That’s an increase of 4%. It’s the first time in Bitcoin’s history we’ve closed over $19,000 since 18 December 2017. We’ve now closed 8 consecutive days over $17,000. The previous record was 4 days.
The daily high yesterday was $19,348.27, while the daily low was $18,128.66. This time last year, the price of bitcoin closed the day at $7,047.92 and in 2018 it was $3,880.76.
We’re 4.89% below bitcoin‘s all-time high of $20,089 (17 December 2017).
As of today, buying bitcoin has been profitable for…
99.8% of all days since 2013-04-28.
Bitcoin volume
The volume traded yesterday was $51,469,565,009, up from $42,741,112,308 the day before. That’s the highest daily volume since 29 October 2020. High volumes indicate that a significant price movement has stronger support and is more likely to be sustained. In the bull run of December-January 2018, the highest daily volume was $23,840,899,072.
Market capitalisation
Bitcoin’s market capitalisation as of yesterday was $354,504,361,032, up from $340,698,070,308 the day before. That’s the highest it’s ever been. It’s now higher than both Mastercard and Procter & Gamble’s market caps, which are both $342 billion.
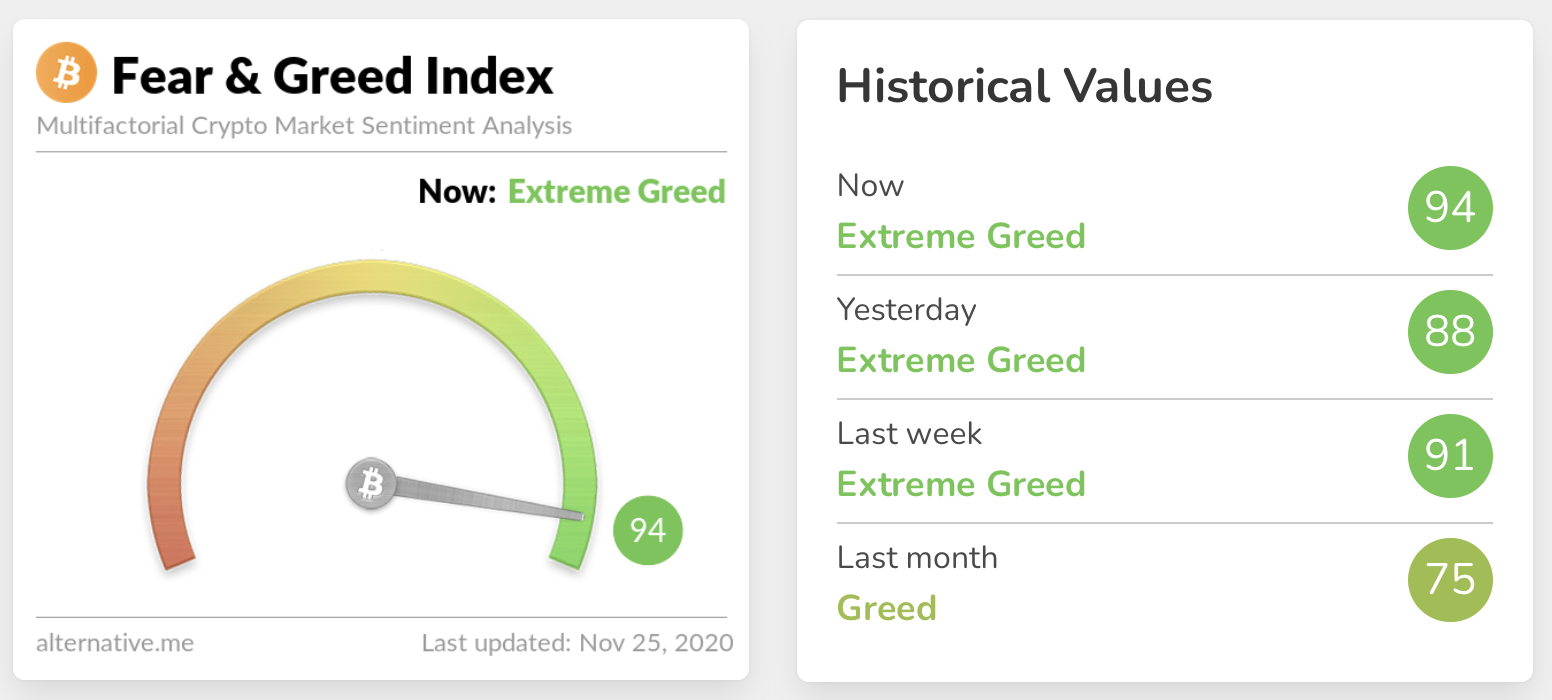
Fear and Greed Index
The sentiment is still in Extreme Greed at 94. The last time it was below 80 was 5 November. The index has only been higher once, when it touched 95 last summer. The index has now spent a record length of time in Extreme Greed and it’s important to note that the index doesn’t stay this high very often and a correction could be on the cards.
In/Out of the money
For any address with a balance of tokens, ITB identifies the average price (cost) at which those tokens were purchased and compares it with the current price. If the current price is higher than average cost, address is ‘In the Money’. If the current price is lower than the average cost, the address is ‘Out of the Money’.
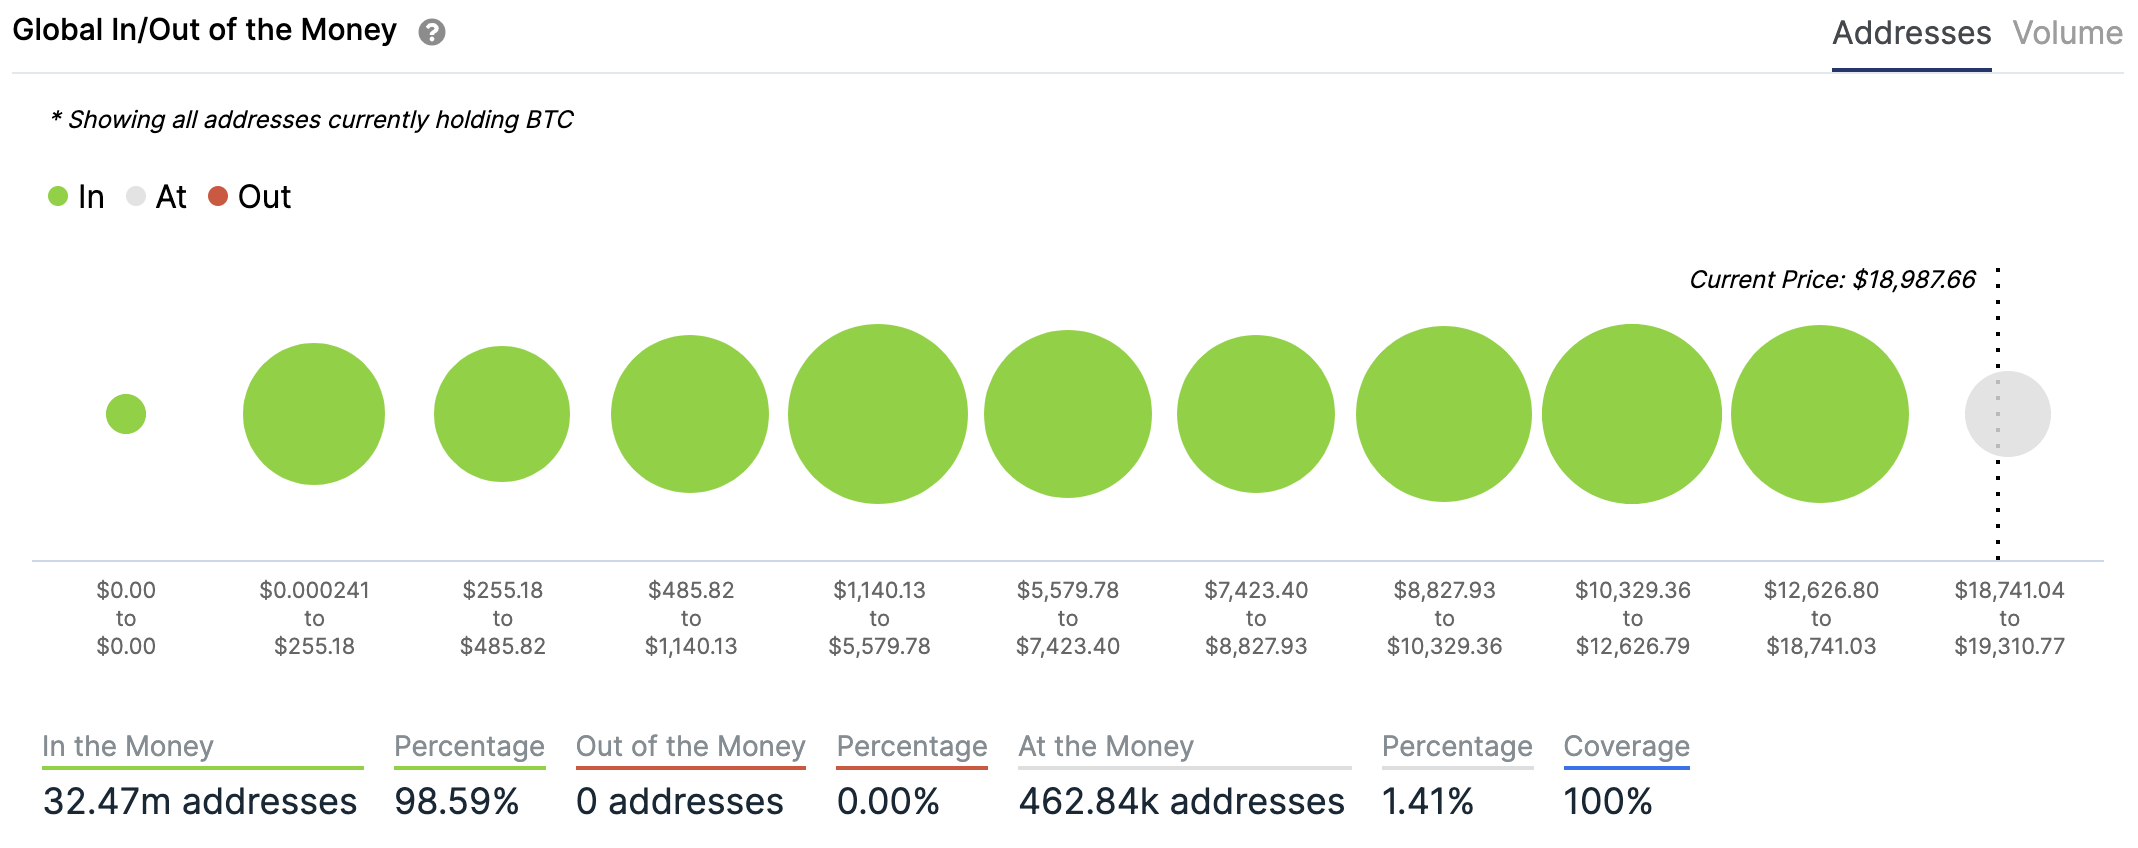
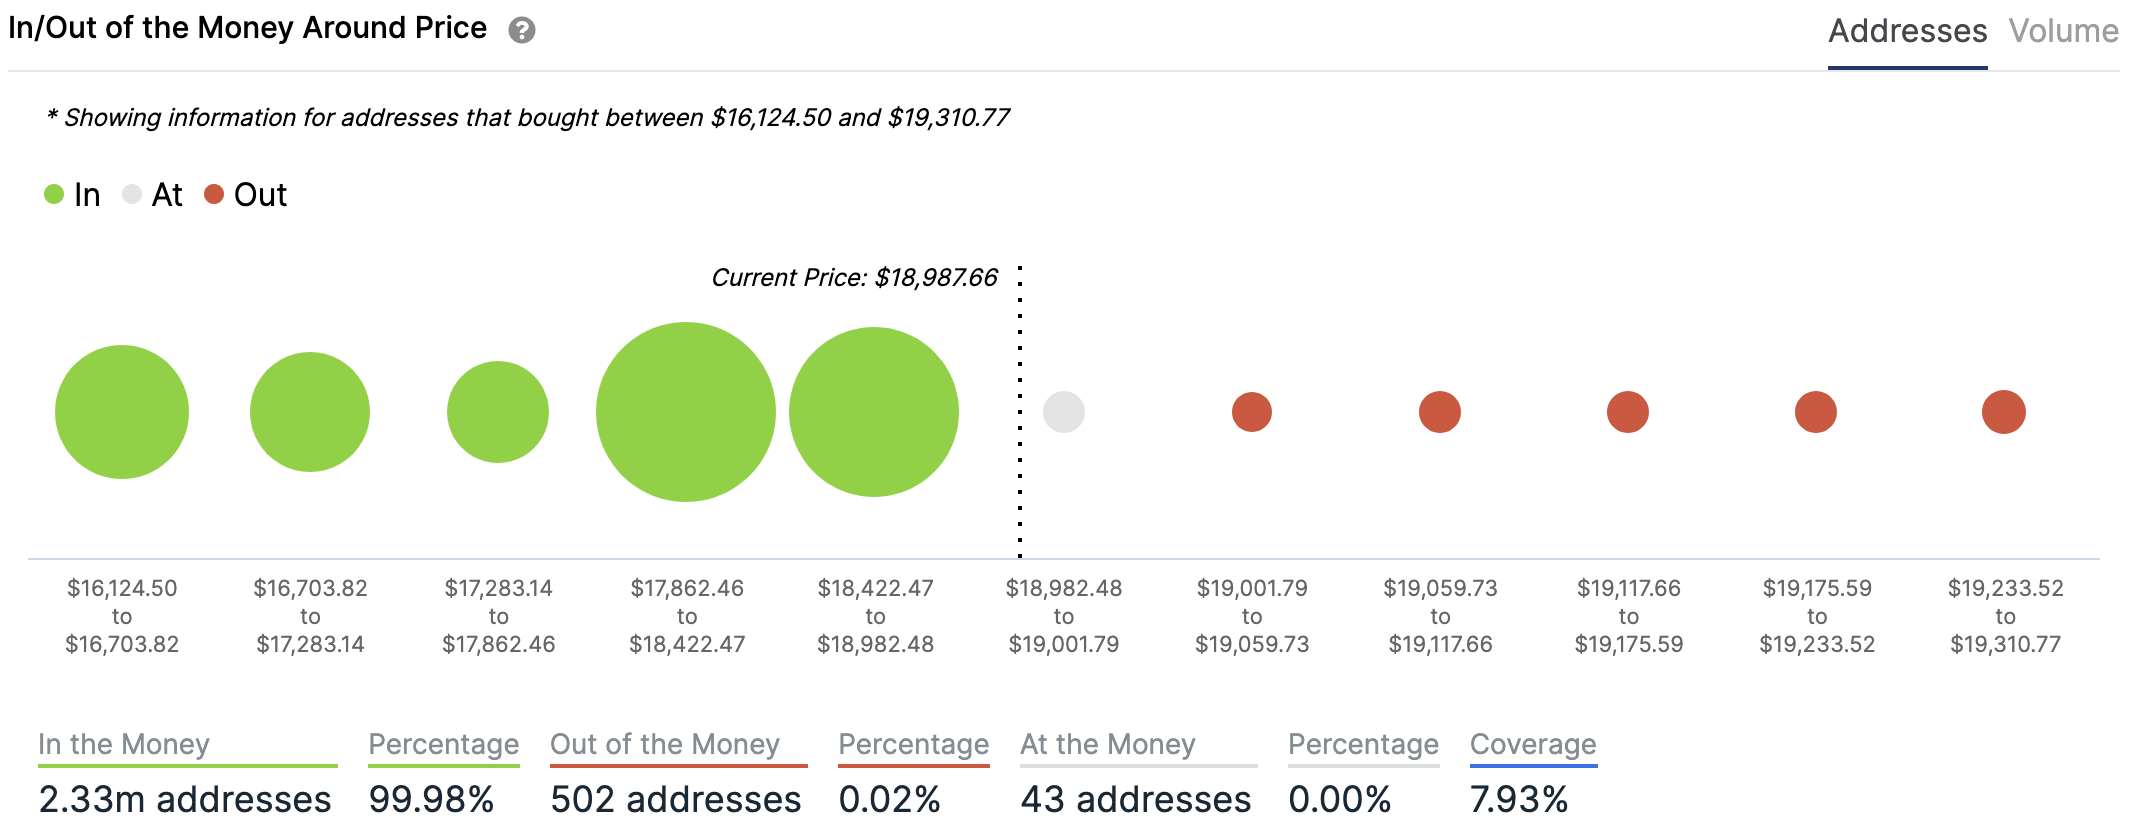
Charts provided by IntoTheBlock.com
Volatility
Annualised price volatility using 365 days.
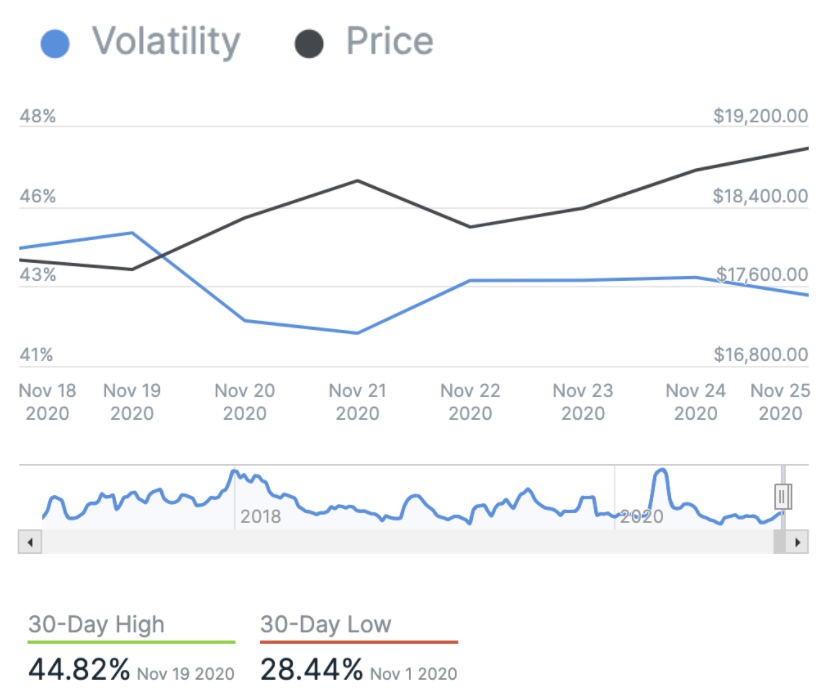
Charts provided by IntoTheBlock.com
Bitcoin’s market dominance
Bitcoin’s market dominance stands at 62.50. Its lowest recorded dominance was 37.09 on 8 January, 2018.
Relative Strength Index (RSI)
The daily RSI is currently 78.70. Values of 70 or above indicate that an asset is becoming overbought and may be primed for a trend reversal or experience a correction in price – an RSI reading of 30 or below indicates an oversold or undervalued condition.
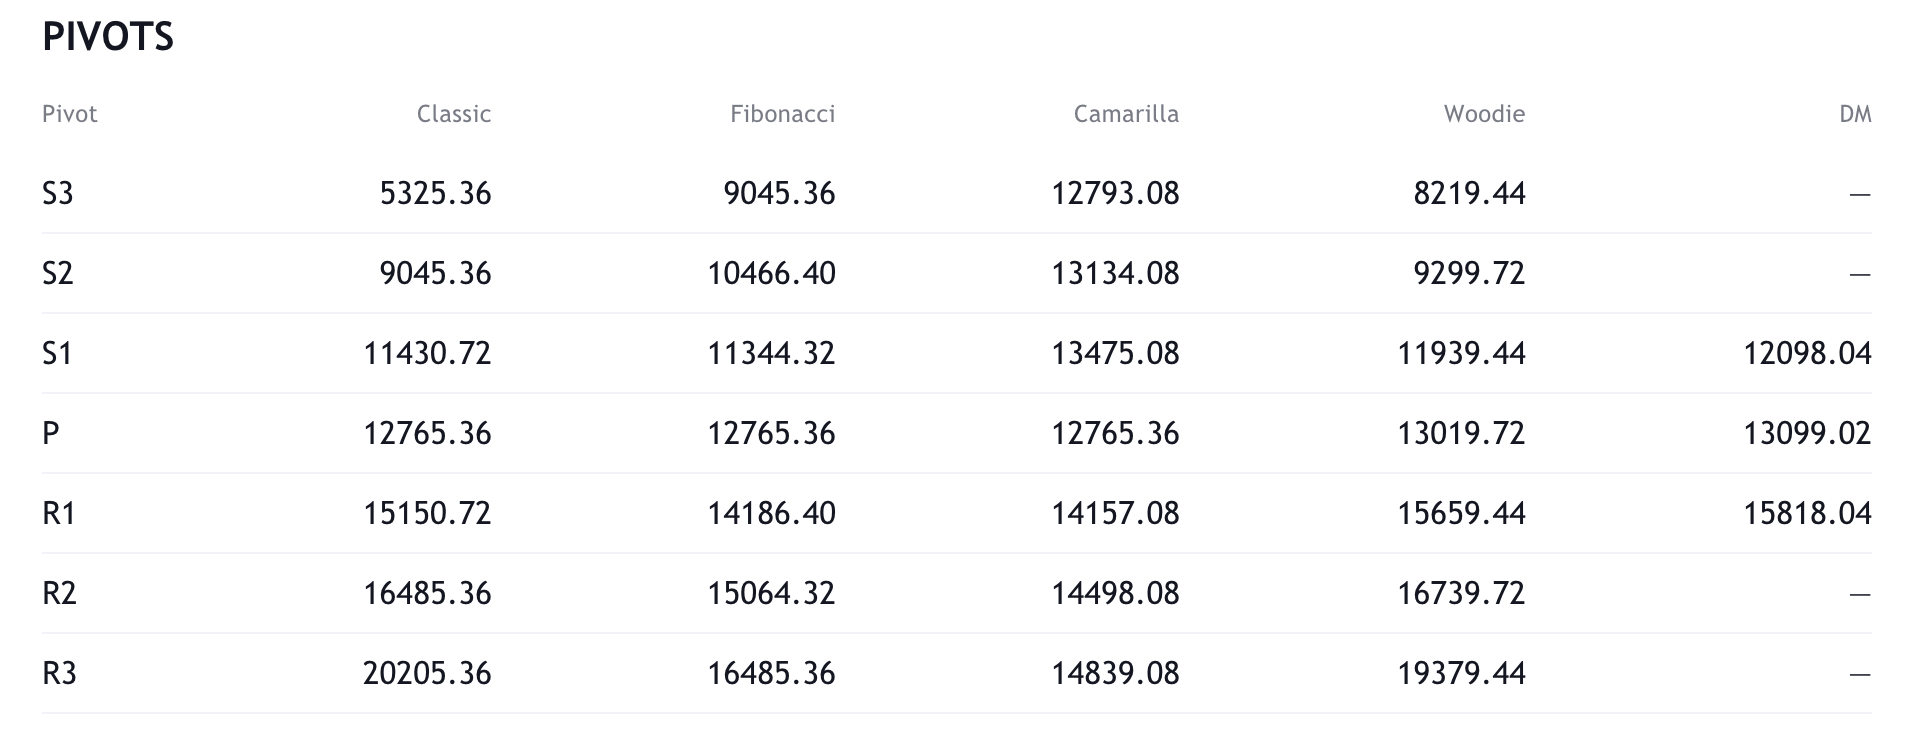
Resistance and support
What they said yesterday…
Season 7 of The Crown is going to be WILD. https://t.co/41BWIm7sc7
— Robin Wigglesworth (@RobinWigg) November 24, 2020
You might think $20k, $30k or $100k per #Bitcoin is expensive, but to a public market company with billions in cash reserves melting away, it’s dirt cheap. pic.twitter.com/77aWKOWJfw
— Samson Mow (@Excellion) November 24, 2020
Uber driver just asked me about Bitcoin
— nic carter ? (@nic__carter) November 24, 2020
Bitcoin haters have been wrong for 12 years.
— PierreRochard.com (@pierre_rochard) November 24, 2020
What other data points would you like to see covered in our Daily Report? Let us know on Twitter.
Did you find this useful?