Discover
 Help Centre
 Status
 Company
 Careers
 Press
PressDaily market update: Bitcoin on track post-halving?

There’s two kinds of people in the world – people who have Bitcoin and people who don’t. If you’re in the first camp, here are all the latest crypto metrics so you can feel smug and maybe think about buying more. If you’re in the latter camp, read it anyway to see what you’re missing.
Also, if you’re new to the world of crypto trading, take a look through our beginner’s guide to crypto trading series, starring in-depth explorations of common strategies, market analysis techniques, and more.
The content of this article is for information purposes only and is not investment advice or any form of recommendation or invitation. Luno always advises you to obtain your own independent financial advice before investing or trading in cryptocurrency.
All information is correct as of 09:30am BST
Bitcoin price
We closed yesterday, 31 August 2020, at a price of $11,680.82 – with a daily high of $11,768.88 and a low of $11,598.32.
That’s down from $11,711.51 the day before. On the same date last year, the closing price was $9,630.66.
We’re 41.85% below bitcoin‘s all-time high of $20,089 (17 December 2017).
As of today, buying bitcoin has been profitable for…
96.3% of all days since 2013-04-28.
Bitcoin volume
The volume traded yesterday was $22,285,928,250 – up from $19,760,127,945 the day before.
Market capitalisation
Bitcoin’s market capitalisation as of yesterday was $215,817,677,822, down from $216,373,660,045 the day before. To put that into context, Jeff Bezos’s net worth is $196,000,000,000, which means he could only buy 90.81% of all Bitcoin. You can’t have everything, Jeff!
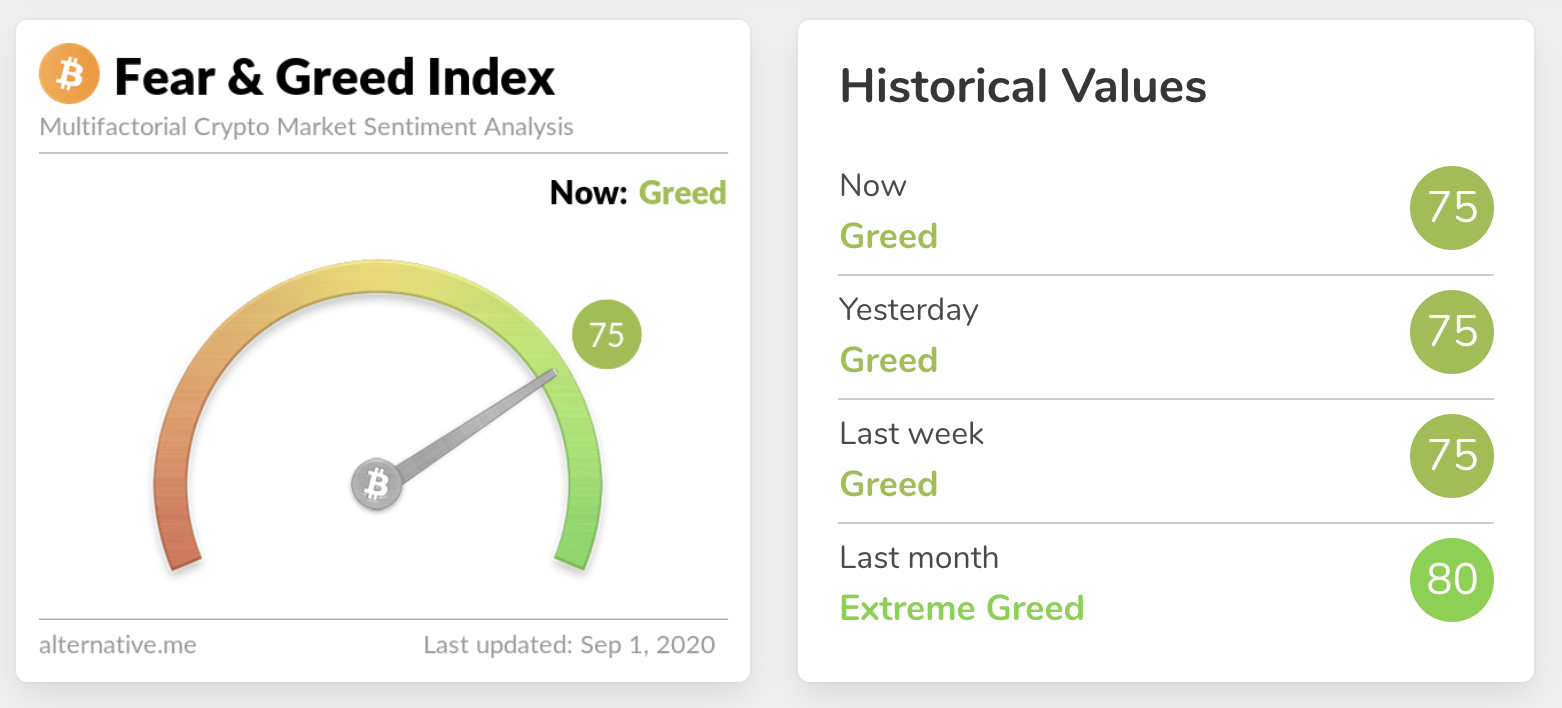
Fear and Greed Index
We’re still at 75 in the general Greed zone, the same as yesterday. Extreme fear can be a sign that investors are too worried, which could be a buying opportunity. When Investors are getting too greedy, that means the market may be due for a correction.
Volatility

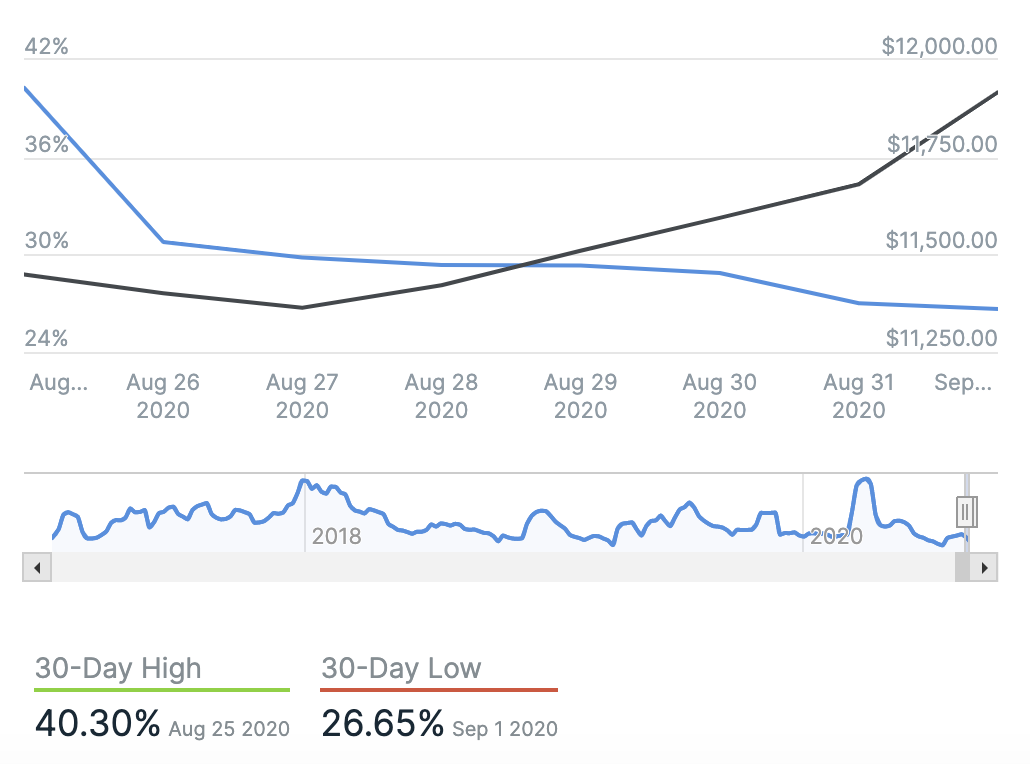
Data courtesy of Into The Block
Daily active addresses

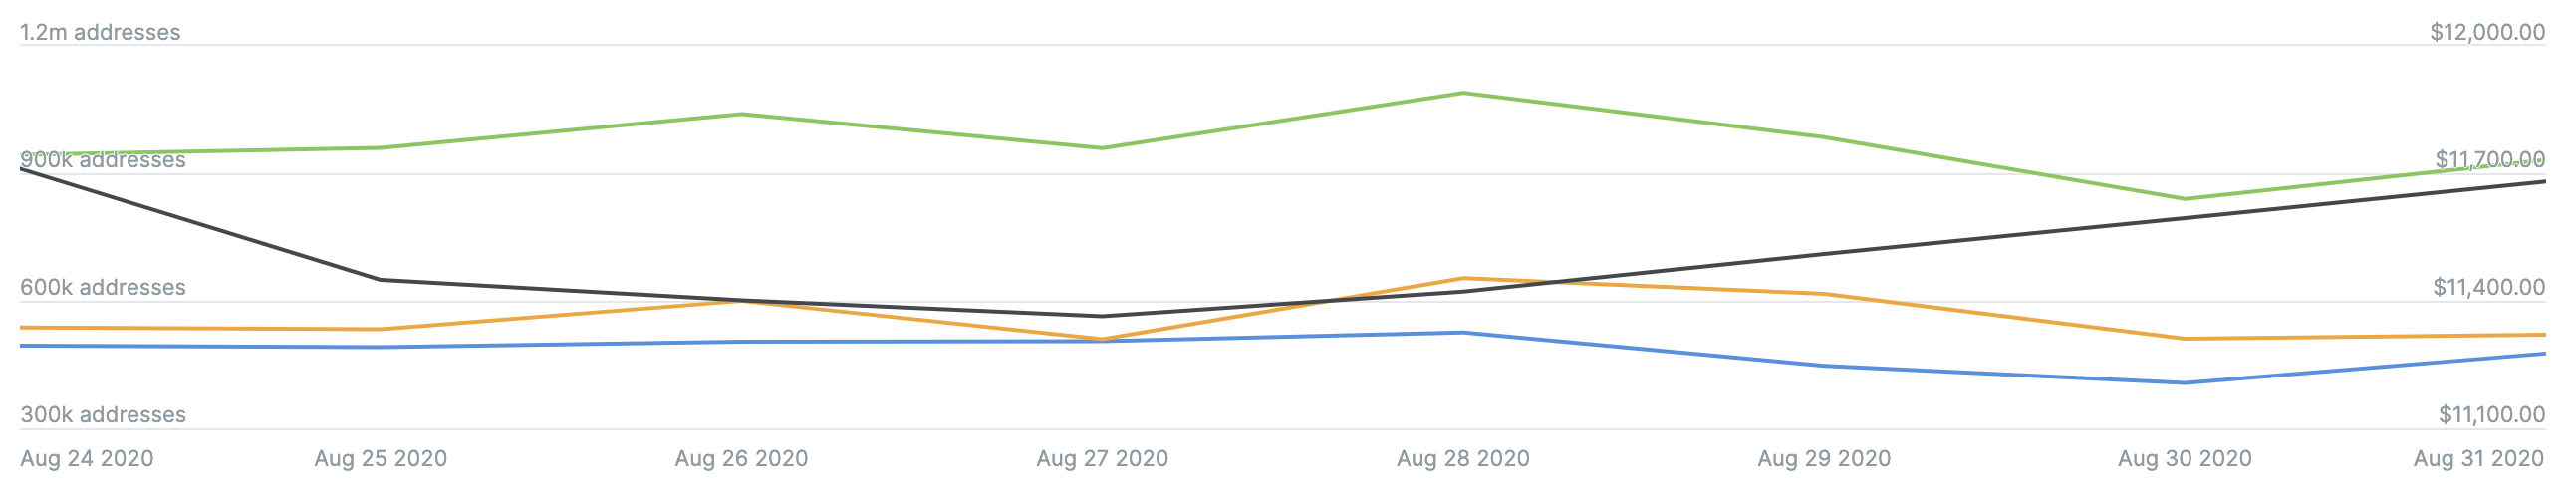
Data courtesy of Into The Block
Bitcoin’s market dominance
Bitcoin’s market dominance stands at 69.60. Its lowest recorded dominance was 37.09 on 8 January, 2018.
Relative Strength Index (RSI)
The daily RSI is currently 58.69. Values of 70 or above indicate that an asset is becoming overbought and may be primed for a trend reversal or experience correction in price – an RSI reading of 30 or below indicates an oversold or undervalued condition.
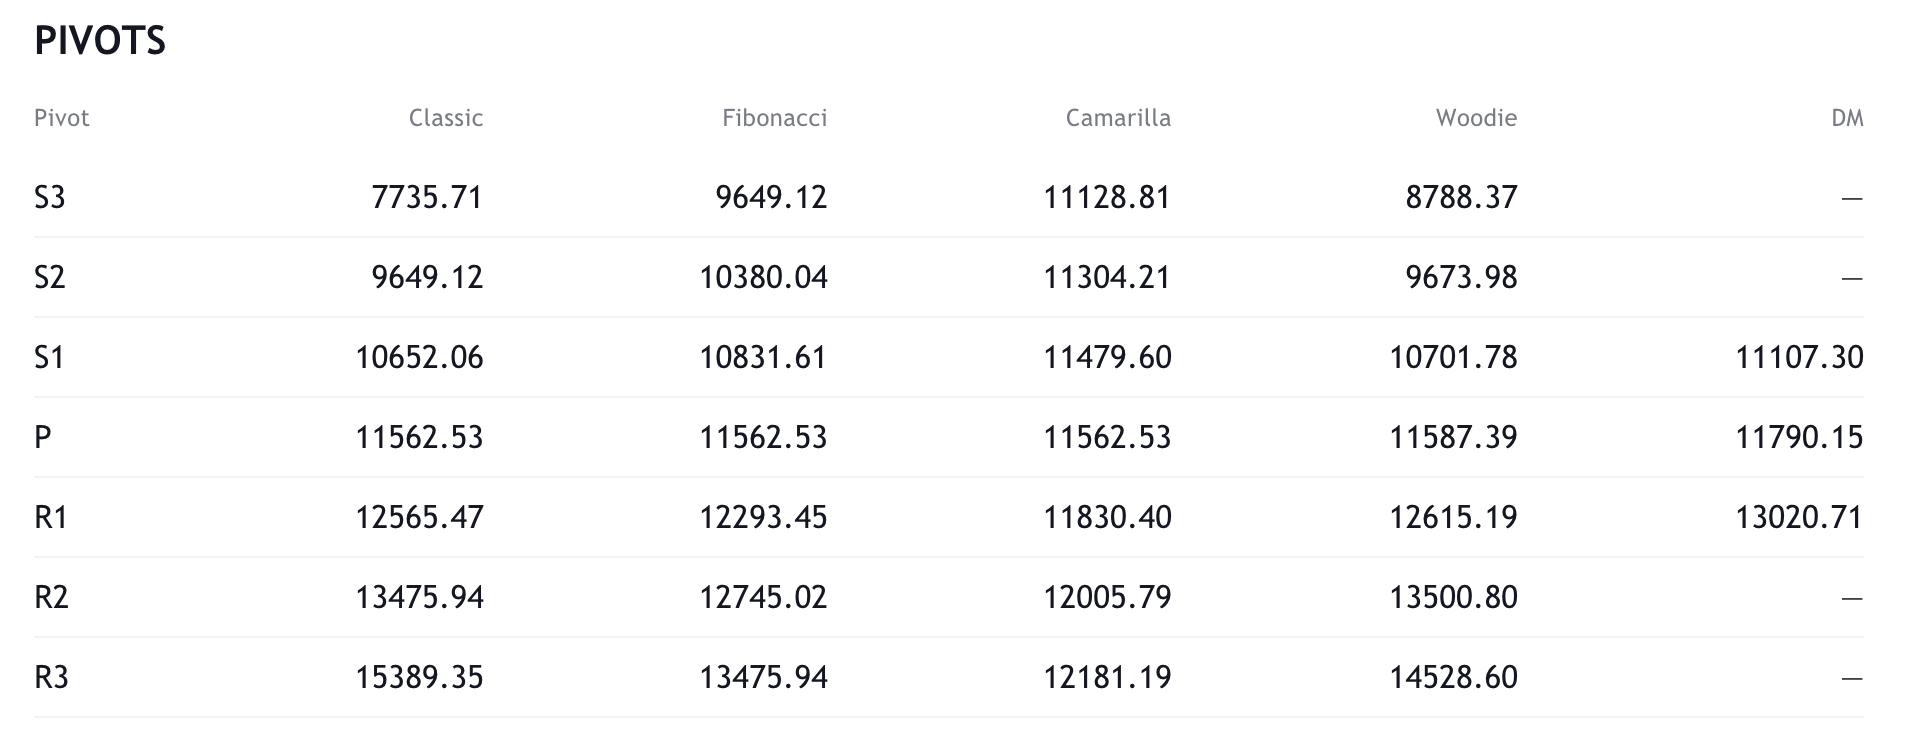
Resistance and support
What they said yesterday…
#Bitcoin after the Halving
Aug. 31, 2020111 days after the 3rd halving.#BTC at $11,732.
Looking solid ? pic.twitter.com/xBbcf3jLKH
— ecoinometrics (@ecoinometrics) August 31, 2020
#bitcoin yearly candles pic.twitter.com/GCt3dtwGLQ
— ChartsBTC (@ChartsBtc) August 31, 2020
If you own #bitcoin right now and HODL, you will be thought of by peers, family, and investors as a legend in the near future.
A f’n visionary in fact.
— Jason A. Williams? (@GoingParabolic) August 31, 2020
No one ever saw a #Bitcoin
— Sticker Mule (@stickermule) September 1, 2020
Britain’s reserve currency status lasted 105 years.
France’s reserve currency status lasted 95 years.
Spain’s reserve currency status lasted 111 years.USA’s reserve currency status is on year 99.
The Bitcoin Standard is coming.
— Dan Held (@danheld) August 31, 2020
What other data points would you like to see covered in our Daily Report? Let us know on Twitter.
Did you find this useful?