Discover
 Help Centre
 Status
 Company
 Careers
 Press
PressDaily market report: Bitcoin punching over $11,000 again

Things are looking up again, with bitcoin clocking up another daily high over $11,000. Will the run continue?
Here’s today’s stat attack so you can make your own mind up. If you’re new to the world of crypto trading, don’t forget to take a look through our beginner’s guide to crypto trading series, starring in-depth explorations of common strategies, market analysis techniques, and more.
The content of this article is for information purposes only and is not investment advice or any form of recommendation or invitation. Luno always advises you to obtain your own independent financial advice before investing or trading in cryptocurrency.
All information is correct as of 10.00am BST.
Bitcoin price
We closed yesterday, 16 September, 2020, at a price of $10,974.90 – with a daily high of $11,100.12 and a low of $10,704.88.
That’s up from a closing price of $10,796.95 the day before. On the same day last year, one bitcoin would have set you back a cool $10,276.79. That’s a 6.8% increase year-on-year.
We’re 45.37% below bitcoin‘s all-time high of $20,089 (17 December 2017).
Bitcoin volume
The volume traded yesterday was $30,769,986,455 – down from $32,509,451,925 the day before. That’s the lowest daily volume since 9 September 2020.
Market capitalisation
Bitcoin’s market capitalisation as of yesterday was $202,942,925,722, up from $199,641,896,762 the day before. To put that into context, Jeff Bezos is again worth $185.1 billion after tech stocks plunged recently. So again, he could only buy 91% of all bitcoin. Sucks to be you, Jeff.
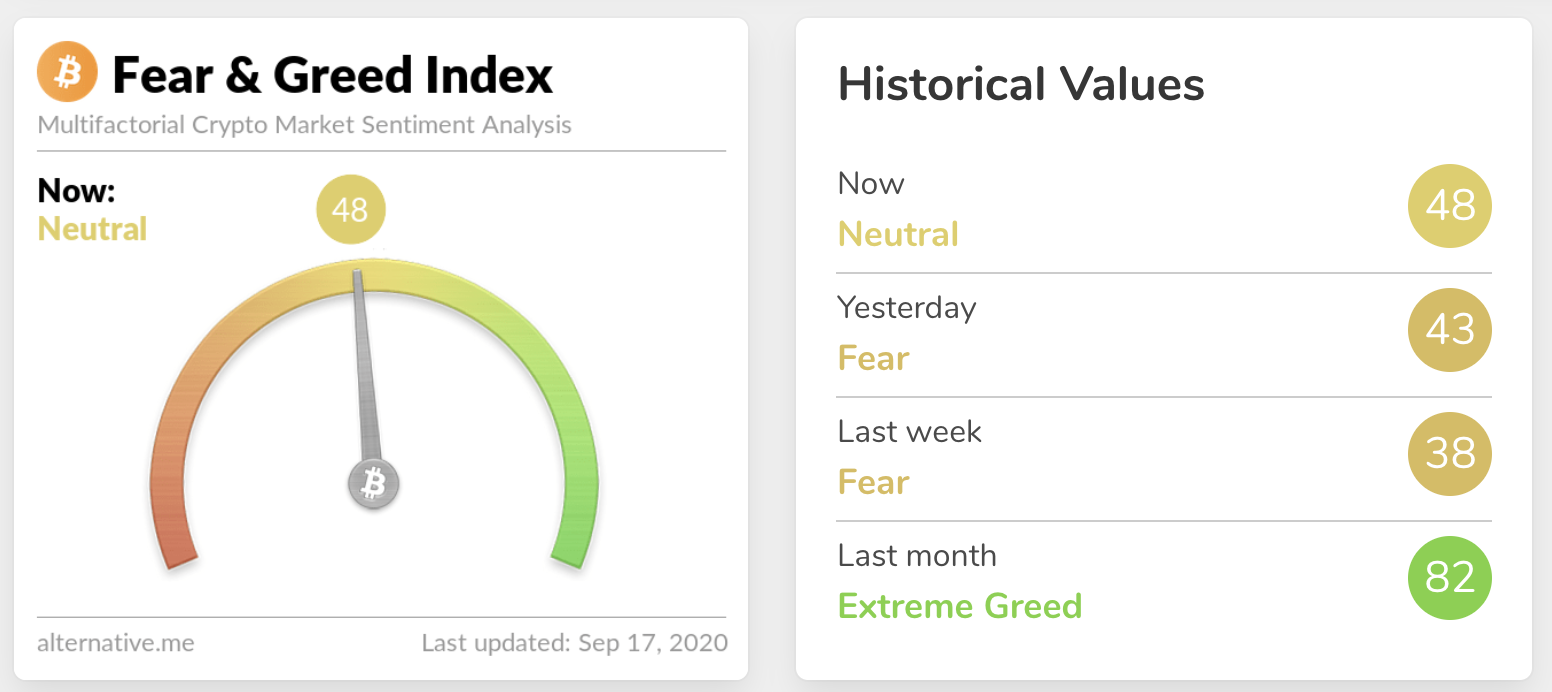
Fear and Greed Index
With more upwards price action, sentiment is up again from 43 to 48 – its highest level since 3 September.
Extreme fear can be a sign that investors are too worried, which could be a buying opportunity. When Investors are getting too greedy, that means the market may be due for a correction.
Global In/Out of the money
For any address with a balance of tokens, ITB identifies the average price (cost) at which those tokens were purchased and compares it with the current price. If the current price is higher than average cost, address is ‘In the Money’. If the current price is lower than the average cost, the address is ‘Out of the Money’.
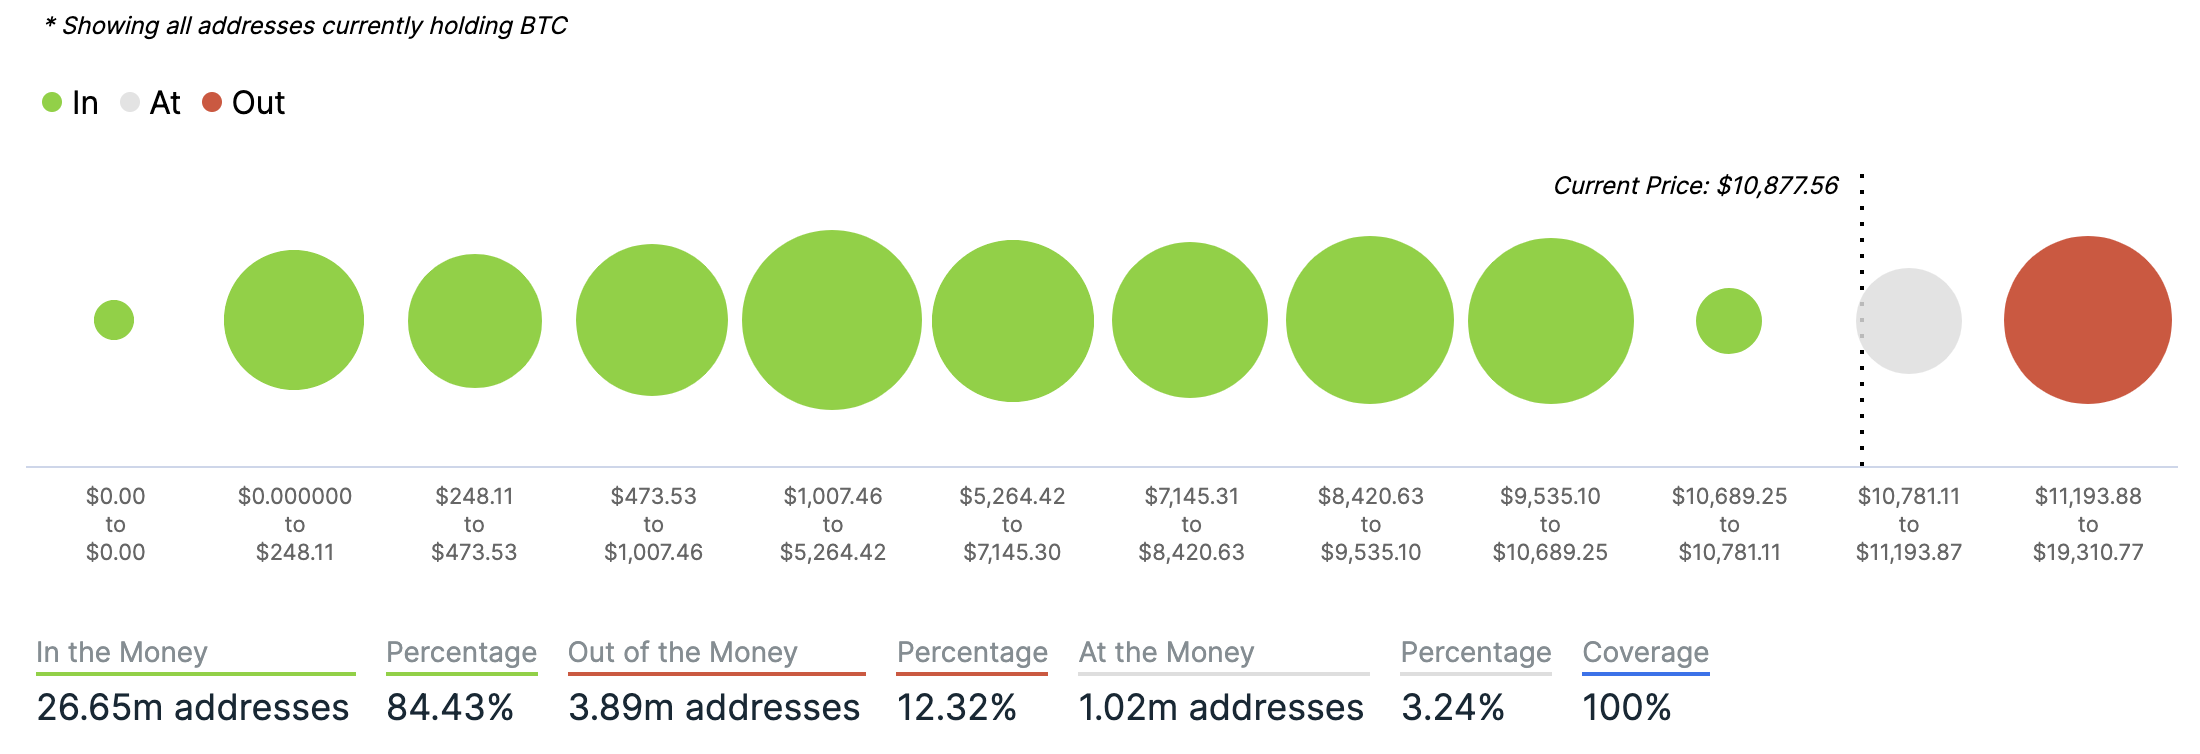
Chart courtesy of IntoTheBlock.com
Volatility
Annualised price volatility using 365 days.
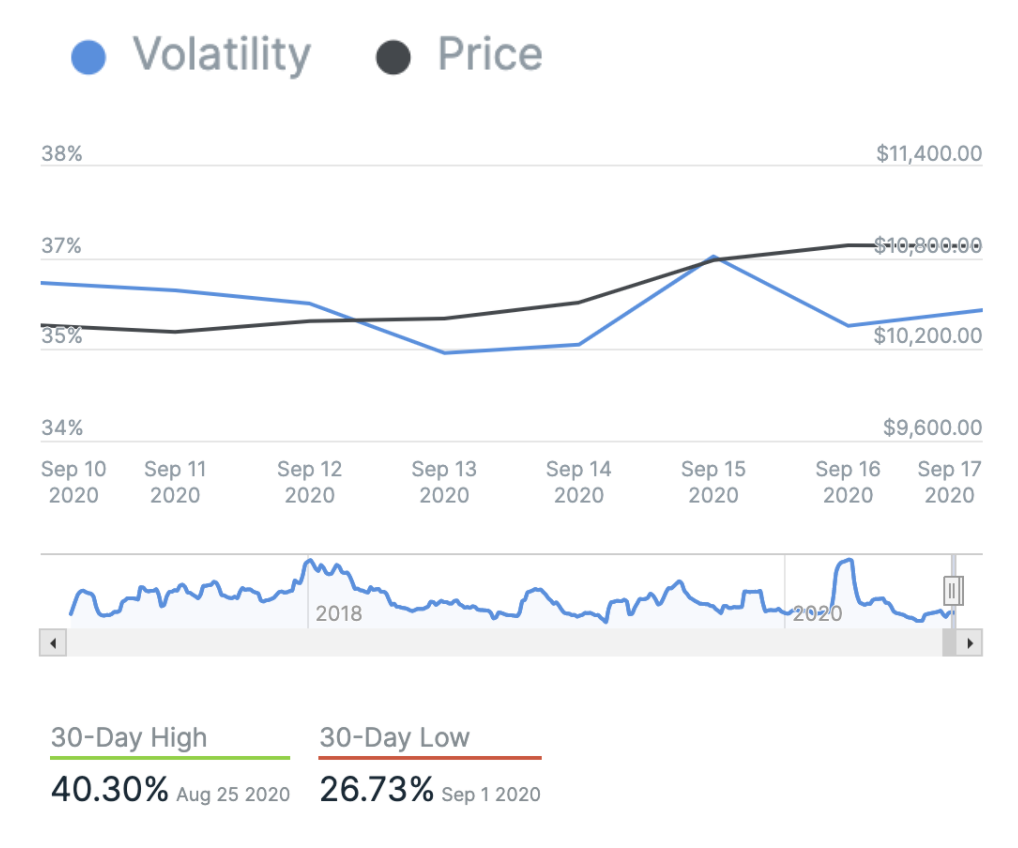
Chart courtesy of IntoTheBlock.com
Bitcoin’s market dominance
Bitcoin’s market dominance stands at 60.85. Its lowest recorded dominance was 37.09 on 8 January, 2018.
Relative Strength Index (RSI)
The daily RSI is currently 50.76. Values of 70 or above indicate that an asset is becoming overbought and may be primed for a trend reversal or experience correction in price – an RSI reading of 30 or below indicates an oversold or undervalued condition.
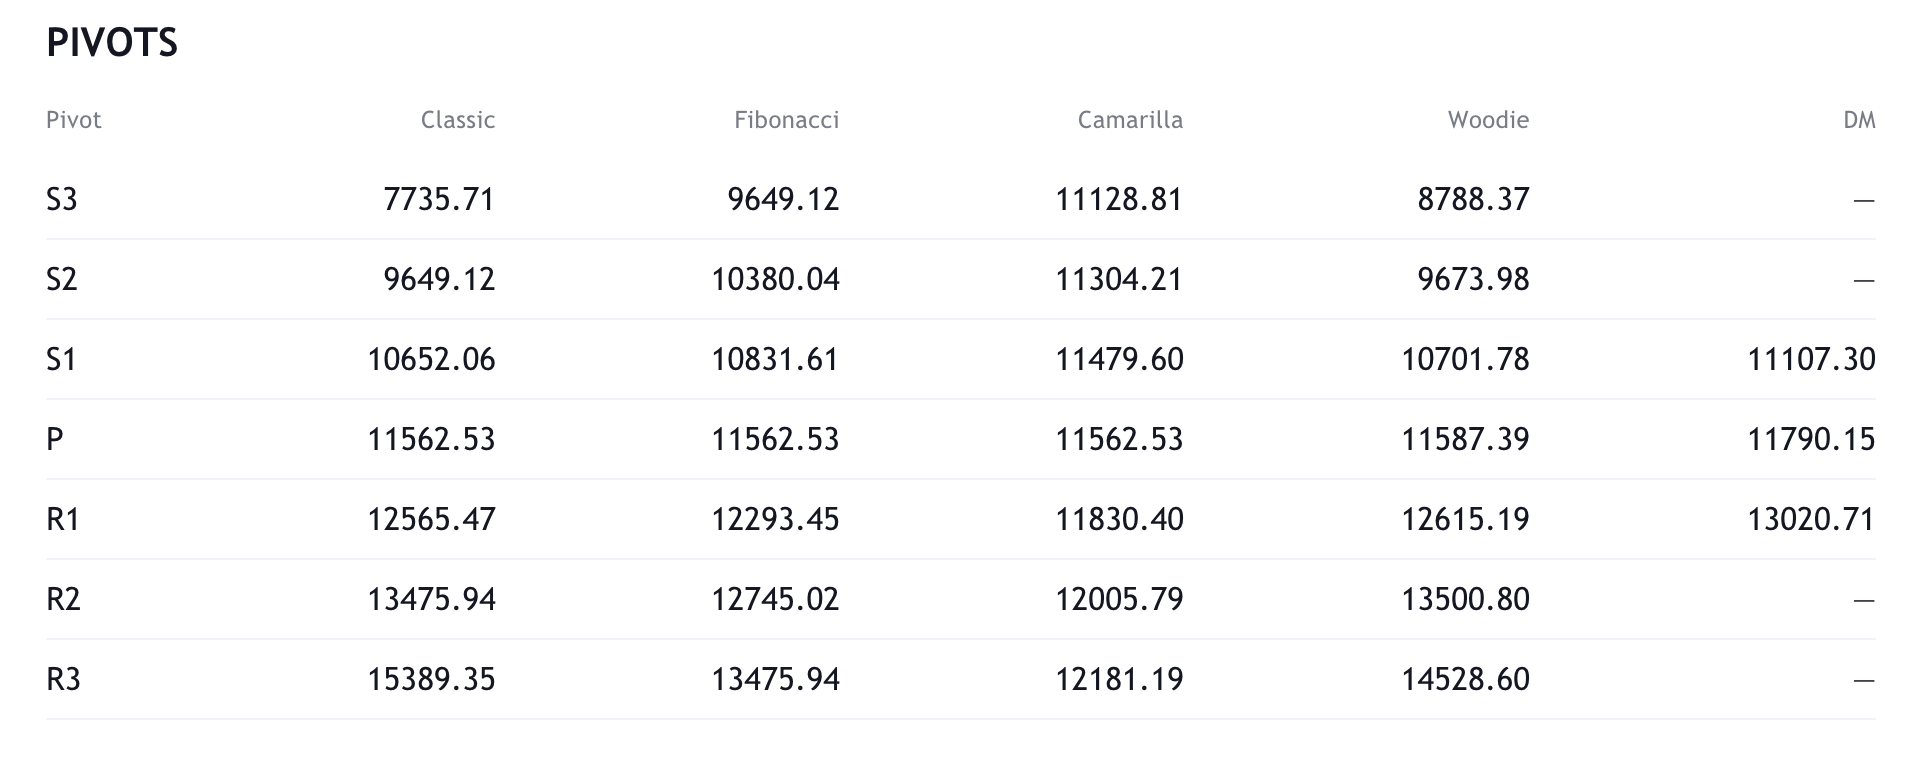
Resistance and support
What they said yesterday…
Kraken becomes the first Bitcoin bank. pic.twitter.com/E69nlSKOoE
— Dan Held (@danheld) September 16, 2020
The herd is coming. Slower than I once thought but the future is now. Buy Bitcoin. Learn and invest in DEFi. 2021 these old guys are in. So beat them to it. ? pic.twitter.com/bHsYQwgb5f
— Mike Novogratz (@novogratz) September 17, 2020
You got that, public???
Opt out of this madness people.
Buy #bitcoin pic.twitter.com/Tc9gZ1owis
— John Vallis (@johnkvallis) September 16, 2020
The United States will be the first country to adopt #Bitcoin as its national currency.
— Jason A. Williams ? (@GoingParabolic) September 16, 2020
What other data points would you like to see covered in our Daily Report? Let us know on Twitter.
Did you find this useful?