Discover
 Help Centre
 Status
 Company
 Careers
 Press
PressDaily market update: “Nigeria leaves the USA behind in number of Bitcoin wallets downloads”
Bitcoin has now been over $10,000 for the second-most consecutive days in its history at 29 days – its previous best was 63 days back in 2017. Will its run continue? Check out the latest metrics from across the world of Bitcoin and make your own mind up – everything you need is here, it’s just about putting the dots together.
If you’re new to the world of crypto trading, take a look through our beginner’s guide to crypto trading series, starring in-depth explorations of common strategies, market analysis techniques, and more.
The content of this article is for information purposes only and is not investment advice or any form of recommendation or invitation. Luno always advises you to obtain your own independent financial advice before investing or trading in cryptocurrency.
All information is correct as of 09:00am BST
Bitcoin price
We closed yesterday, 24 August 2020, at a price of $11,774.60 – with a daily high of $11,807.63 and a low of $11,623.25.
The closing price is the highest since 20 August, 2020. The price of Bitcoin has now stayed above $10,000 for the second-longest time in its history.
We’re 41.39% below Bitcoin‘s all-time high of $20,089 (17 December 2017).
As of today, buying bitcoin has been profitable for…
96.5% of all days since 2013-04-28.
Market capitalisation
Bitcoin’s market capitalisation as of yesterday was $217,477,962,650, up from $215,439,967,321 the day before. To put that into context, Jeff Bezos’s net worth is $188,500,000,000, which means he could only buy 86.68% of all Bitcoin. You can’t have everything, Jeff!
Bitcoin volume
The volume traded yesterday was $20,681,511,755. That’s the highest it’s been since 21 August 2020.
To put that into context, the highest ever 24-hour volume is $53,060,690,000, last year’s high was $29,060,690,000, and last year’s average was $15,060,690,000.
Bitcoin’s market dominance
Bitcoin’s market dominance stands at 61.23. Its lowest recorded dominance was 37.09 on 8 January, 2018.
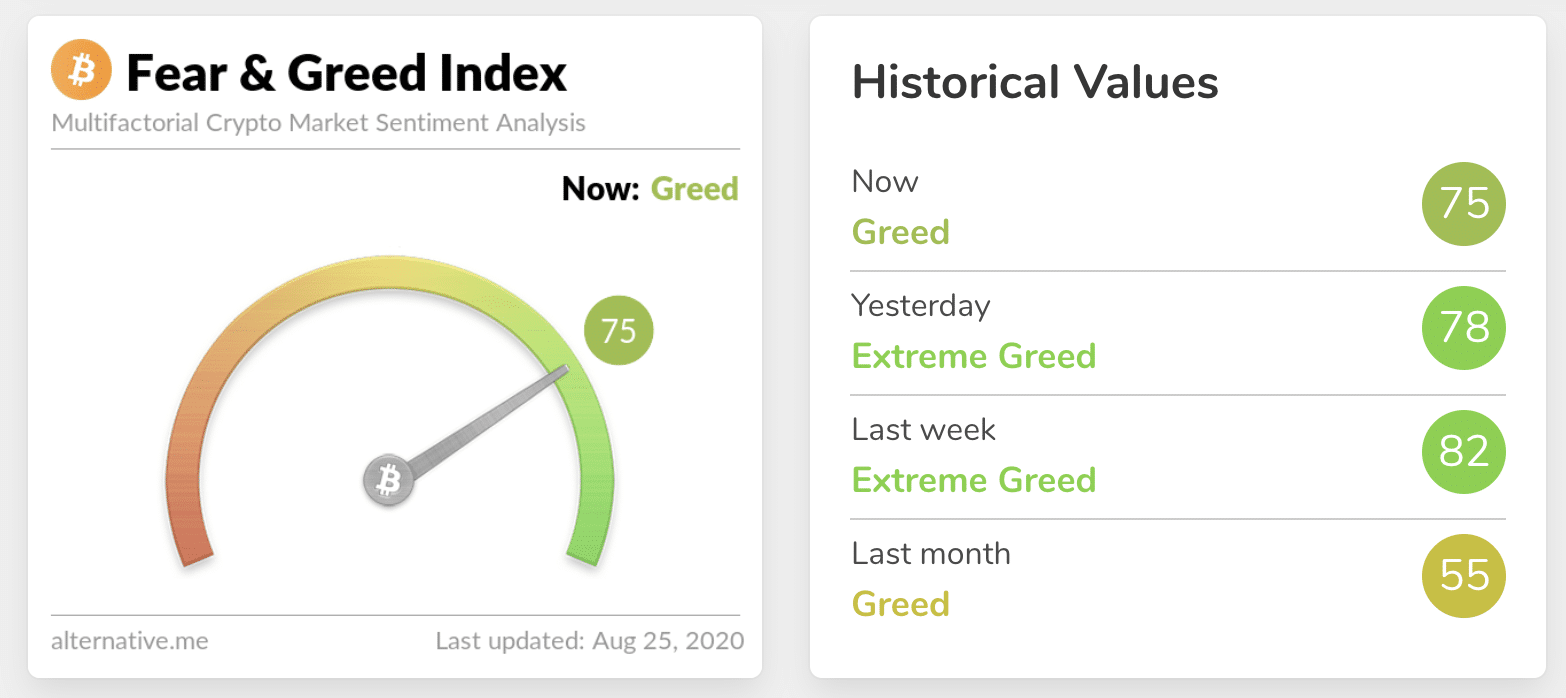
Fear and Greed Index
We’re back down in the Greed zone at 75. We’ve only been below 75 once in August (72 on 4 August). Extreme fear can be a sign that investors are too worried, which could be a buying opportunity. When Investors are getting too greedy, that means the market may be due for a correction.
Relative Strength Index (RSI)
The daily RSI is currently 52.05. Values of 70 or above indicate that an asset is becoming overbought and may be primed for a trend reversal or experience correction in price. – an RSI reading of 30 or below indicates an oversold or undervalued condition.
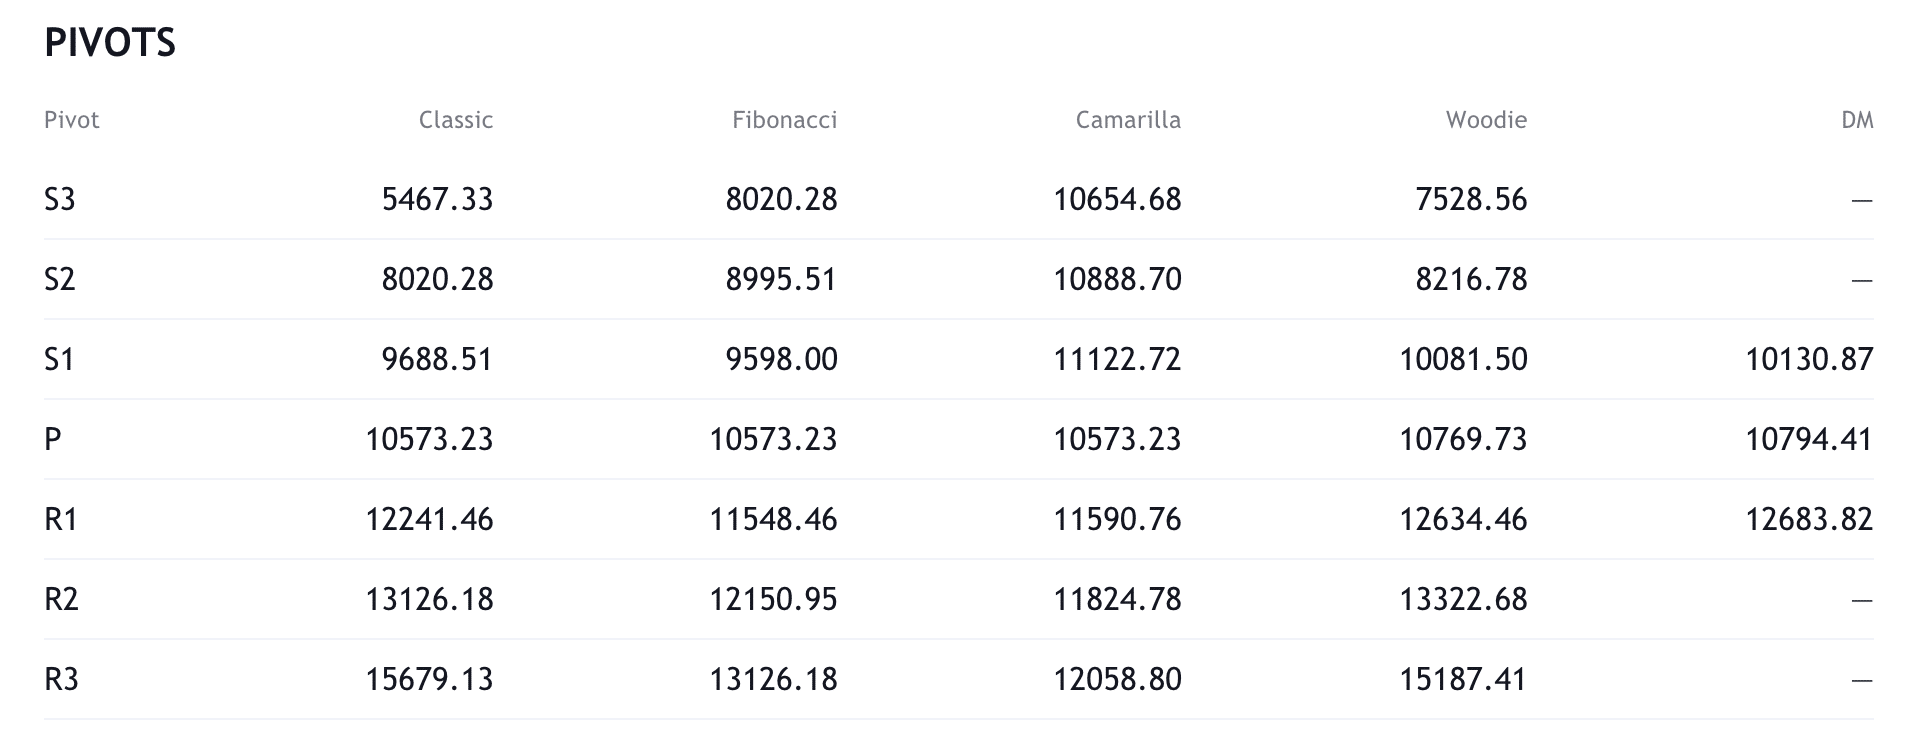
Resistance and support
What they said yesterday…
Given everything going on in the global economy, we began accumulating #Bitcoin starting in March and holding it as a reserve asset on our balance sheet.
My latest article explains the full reasoning behind this decision. Feedback is welcome 🙂https://t.co/NmczcdZIms
— Christopher Gimmer (@cgimmer) August 24, 2020
Nigeria Leaves the USA behind in Number of #Bitcoin Wallets Downloads https://t.co/flTrVjdNTe
— Dennis Parker (@Xentagz) August 24, 2020
I just heard from someone asking how to get access to crypto even though they have zero interest in investment, trading, or saving. Why do they need crypto? Because they regularly donate to SciHub and SciHub can no longer receive donations any other way.
— zooko (@zooko) August 24, 2020
What other data points would you like to see covered in our Daily Report? Let us know on Twitter.
Did you find this useful?