Discover
 Help Centre
 Status
 Company
 Careers
 Press
PressDaily market update: “Bitcoin closes the best Q3 of its WHOLE existence”

It was a fourth ‘red candle’ September in a row for bitcoin (a month in which the price of bitcoin closes lower than it when it started), but no need to be sad ?
It was also the best Q3 in bitcoin’s young history. We’re still over $10,000 and smashing records, with no signs of let up.
Here’s today’s look at the major market indicators. If you’re new to the world of crypto trading, don’t forget to take a look through our beginner’s guide to crypto trading series, featuring in-depth explorations of common strategies, market analysis techniques, and more.
The content of this article is for information purposes only and is not investment advice or any form of recommendation or invitation. Luno always advises you to obtain your own independent financial advice before investing or trading in cryptocurrency.
All information is correct as of 8:30am BST.
Bitcoin price
We closed yesterday, 30 September, 2020, at a price of $10,787.62 – with a daily high of $10,856.53 and a low of $10,689.67.
On the 30 September, 2019, the closing price was $8,293.87. On 30 September, 2018, it was $6,625.56 and the same date in 2017 was $4,338.71.
We’re 46.3% below bitcoin‘s all-time high of $20,089 (17 December 2017).
As of today, buying bitcoin has been profitable for…
93.8% of all days since 2013-04-28.
Bitcoin volume
The volume traded yesterday was $20,759,622,010 – down from $20,459,870,042 the day before.
Market capitalisation
Bitcoin’s market capitalisation as of yesterday was $199,620,143,649, down from $200,742,343,863 the day before. To put that into context, Jeff Bezos is currently worth $175.3 billion. This means he can only afford to buy 87.8% of all bitcoin. Poor Jeff.
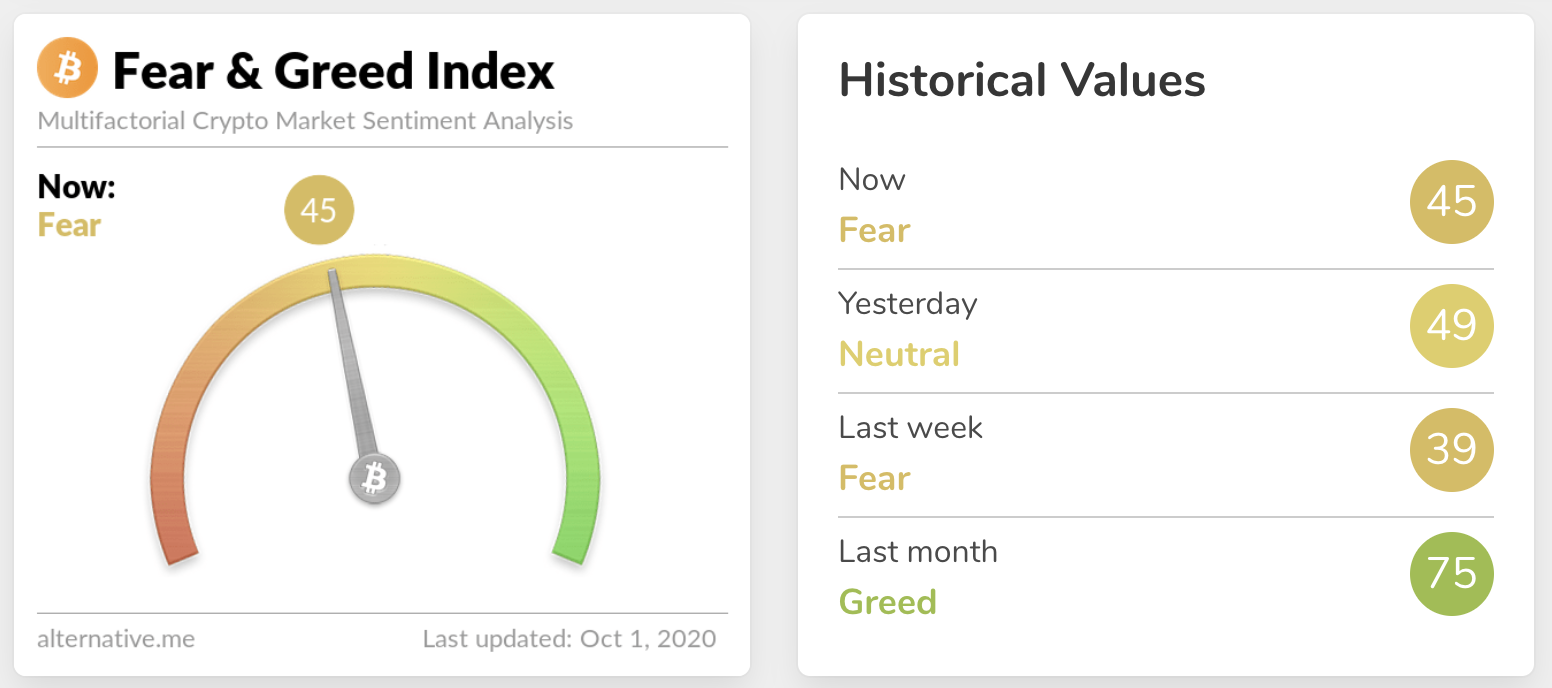
Fear and Greed Index
Sentiment is back down at 45 after a thrilling adventure back into the neutral zone yesterday. Extreme fear can be a sign that investors are too worried, which could be a buying opportunity. When Investors are getting too greedy, that means the market may be due for a correction. Are we set for a big move?
Global In/Out of the money
For any address with a balance of tokens, ITB identifies the average price (cost) at which those tokens were purchased and compares it with the current price. If the current price is higher than average cost, address is ‘In the Money’. If the current price is lower than the average cost, the address is ‘Out of the Money’.
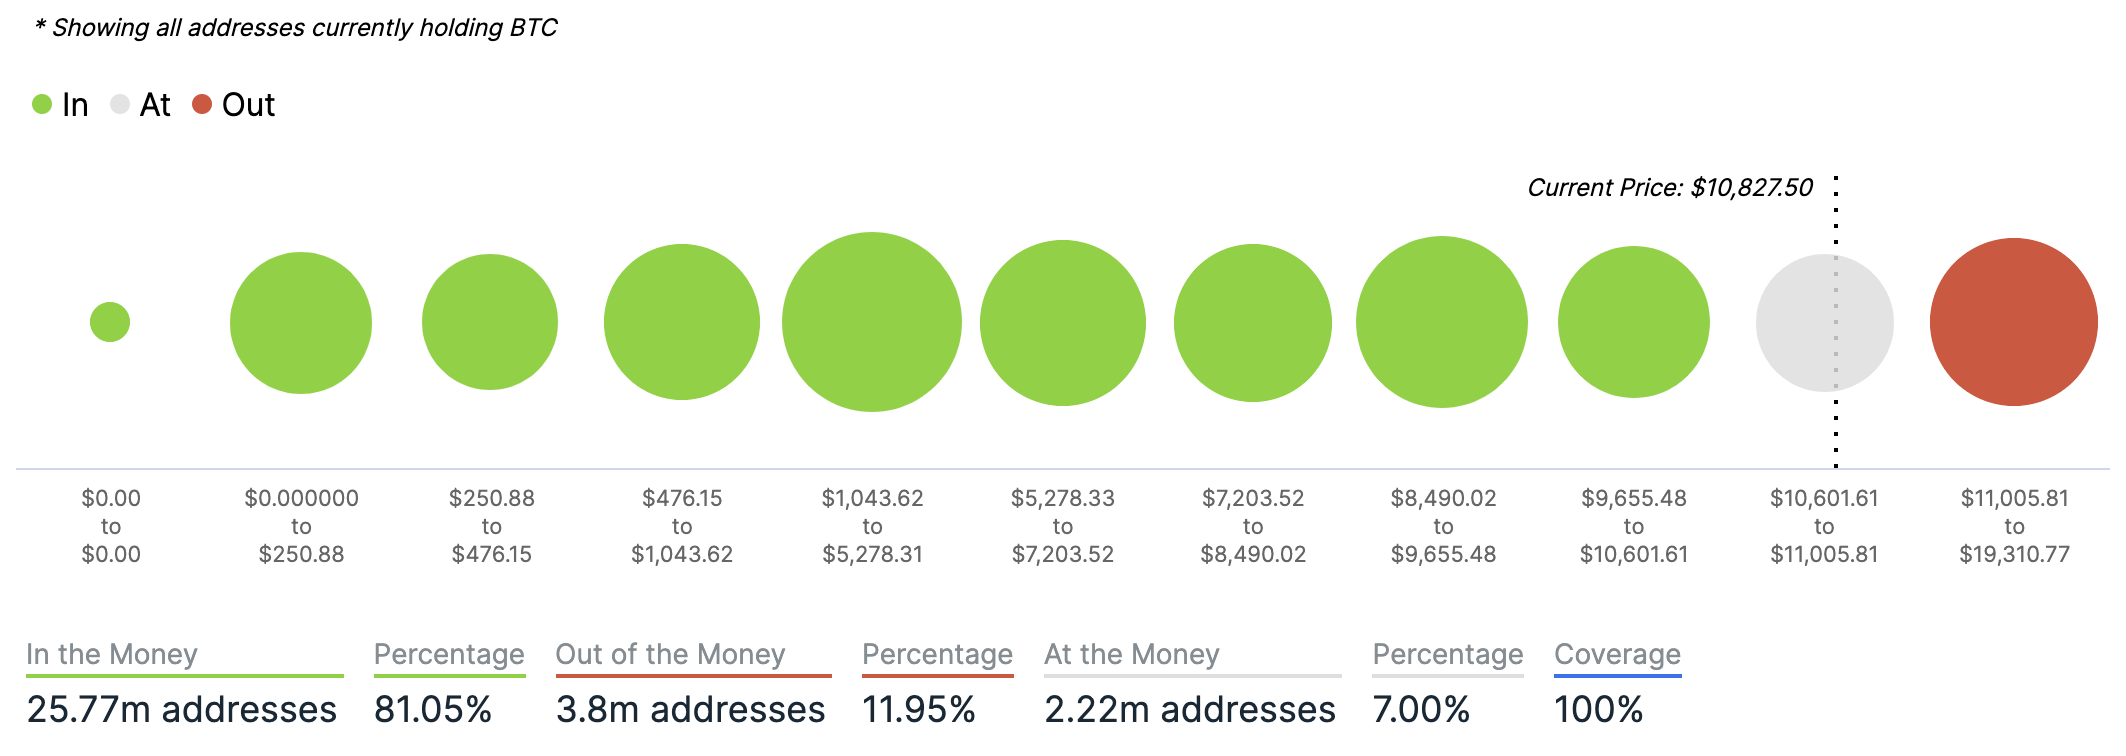
Chart courtesy of IntotheBlock.com
Volatility
Annualised price volatility using 365 days.
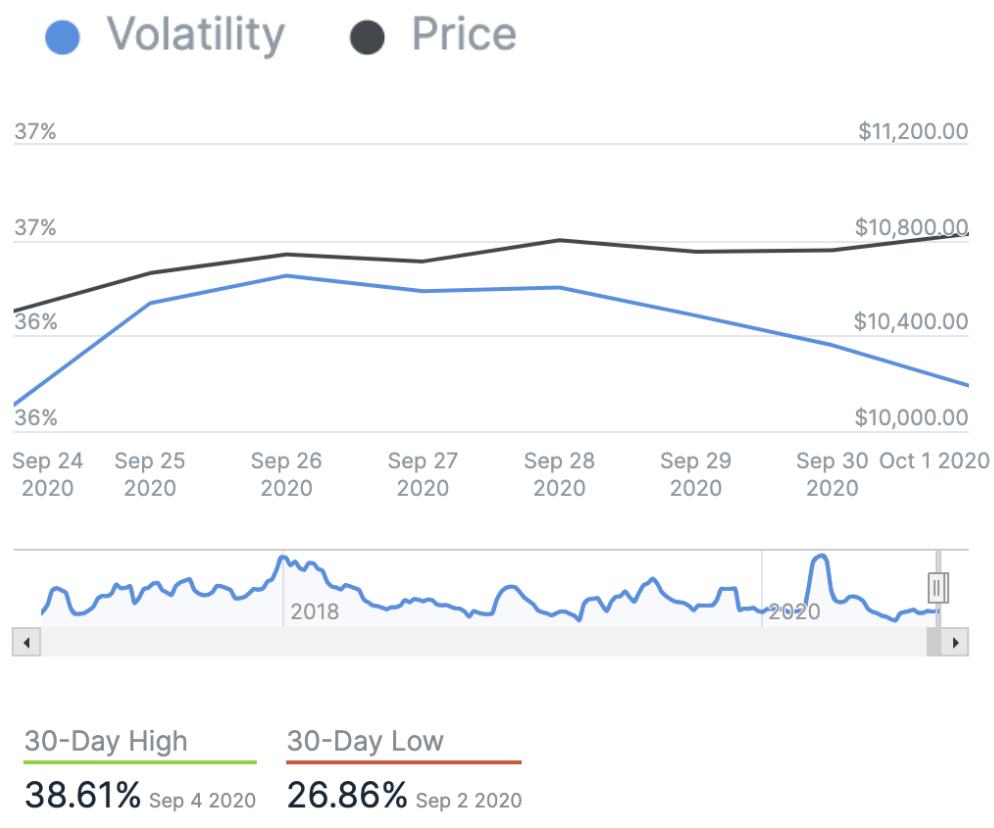
Chart courtesy of IntotheBlock.com
Bitcoin’s market dominance
Bitcoin’s market dominance stands at 58.41. Its lowest recorded dominance was 37.09 on 8 January, 2018.
Relative Strength Index (RSI)
The daily RSI is currently 51.57. Values of 70 or above indicate that an asset is becoming overbought and may be primed for a trend reversal or experience correction in price – an RSI reading of 30 or below indicates an oversold or undervalued condition.
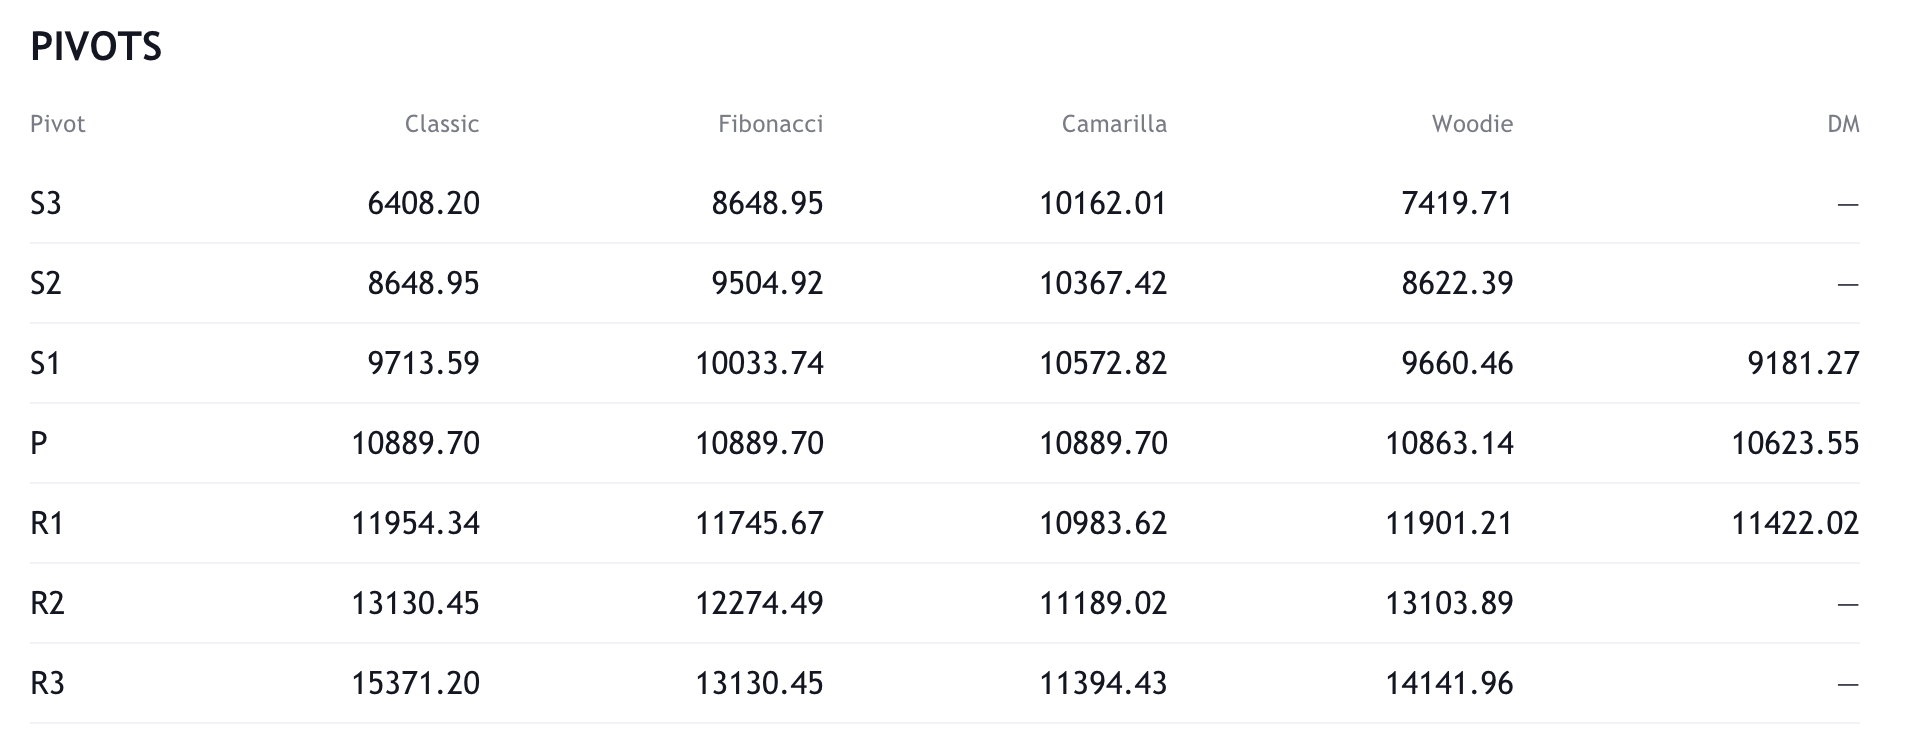
Resistance and support
What they said yesterday…
#Bitcoin is digital gold – growing harder, smarter, faster, & stronger due to the relentless progression of technology.
— Michael Saylor (@michael_saylor) September 30, 2020
We’re seeing a spike in activity by new participants coming into BTC not yet reflected in price, it doesn’t happen often. This is what traders call a divergence, in this case it’s obviously bullish.
Chart by @glassnode pic.twitter.com/WrQueYL9up
— Willy Woo (@woonomic) September 30, 2020
#Bitcoin about to close the best Q3 of its WHOLE existence.
Patience, the trend is your friend. pic.twitter.com/rwqUOEHxo3
— Crypto Rand (@crypto_rand) September 30, 2020
I didn’t. And I don’t. Only Bitcoin.
— jack (@jack) October 1, 2020
What other data points would you like to see covered in our Daily Report? Let us know on Twitter.
Did you find this useful?