Discover
 Help Centre
 Status
 Company
 Careers
 Press
PressDaily market update: Gold drops but Bitcoin holds steady above $15,000

Yesterday saw yet another billionaire go long on Bitcoin. US investor Stanley Druckenmiller – George Soros’ former money manager – told CNBC that while he has more money tied up in gold, he thinks Bitcoin will perform better: “Frankly, if the gold bet works the Bitcoin bet will probably work better because it’s thinner, more illiquid and has a lot more beta to it.” And with gold dropping yesterday, it seems he may have made a good bet.
Here’s your daily look at the latest bitcoin market movements. If you’re new to the world of crypto trading and want to understand more about what these indicators means and how to use them, take a look through our beginner’s guide to crypto trading series, featuring in-depth explorations of common strategies, market analysis techniques, and more.
The content of this article is for information purposes only and is not investment advice or any form of recommendation or invitation. Luno always advises you to obtain your own independent financial advice before investing or trading in cryptocurrency.
All information is correct as of 08:00am GMT.
Bitcoin price
We closed yesterday, 9 November, 2020, at a price of $15,332.32, down from $15,479.57 the day before – a decrease of 0.95%.
The daily high was $15,785.14. The daily low was $14,865.53.
We’re 23.68% below bitcoin‘s all-time high of $20,089 (17 December 2017).
As of today, buying bitcoin has been profitable for…
98.8% of all days since 2013-04-28.
Bitcoin volume
The volume traded yesterday was $34,149,115,566, up from $26,632,075,029 the day before. High volume indicates that a significant price movement has stronger support and is more likely to be sustained.
Market capitalisation
Bitcoin’s market capitalisation as of yesterday was $284,236,108,837, down from $286,955,182,899 the day before.
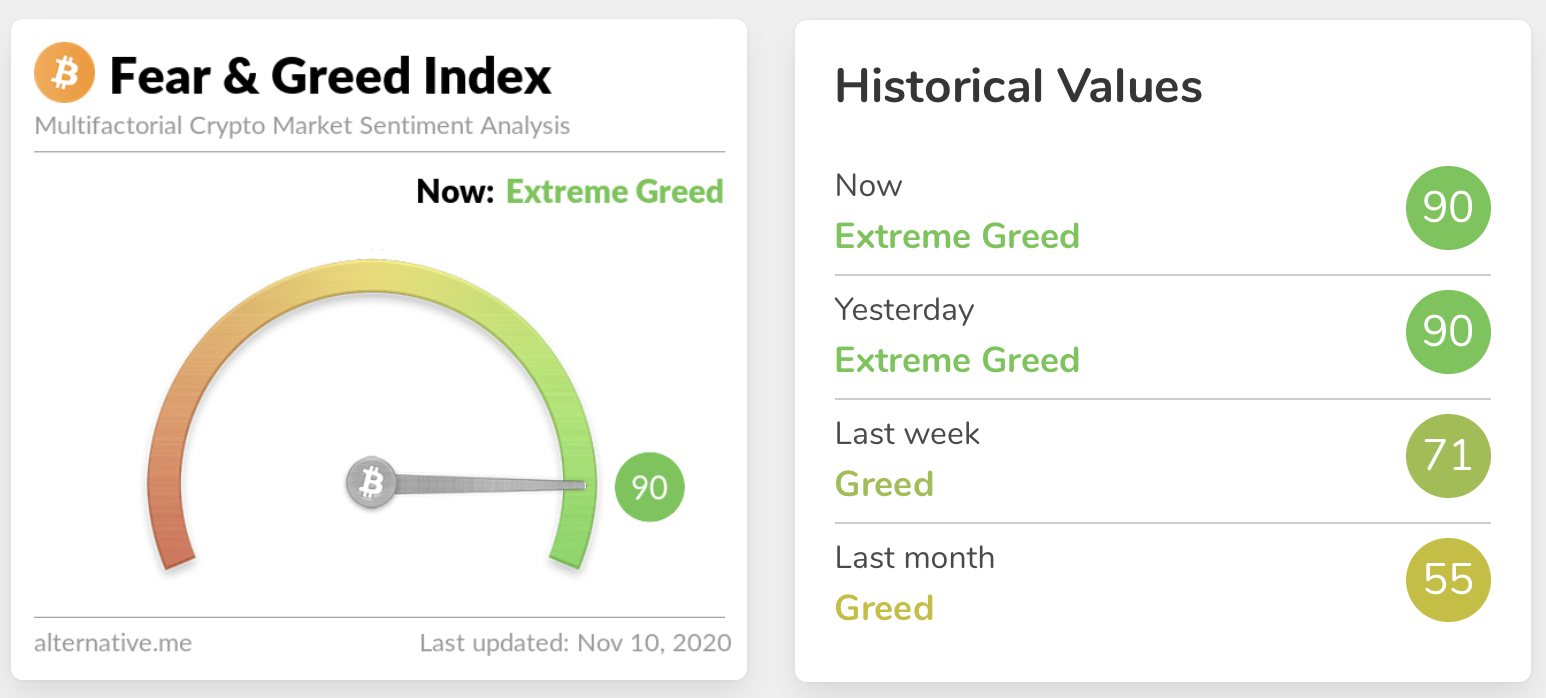
Fear and Greed Index
The sentiment is still in Extreme Greed at 90. Extreme fear can indicate that investors are getting too worried and there’s an opportunity for buyers, while extreme greed could mean the market is due for a correction.
In/Out of the money
For any address with a balance of tokens, ITB identifies the average price (cost) at which those tokens were purchased and compares it with the current price. If the current price is higher than average cost, address is ‘In the Money’. If the current price is lower than the average cost, the address is ‘Out of the Money’.
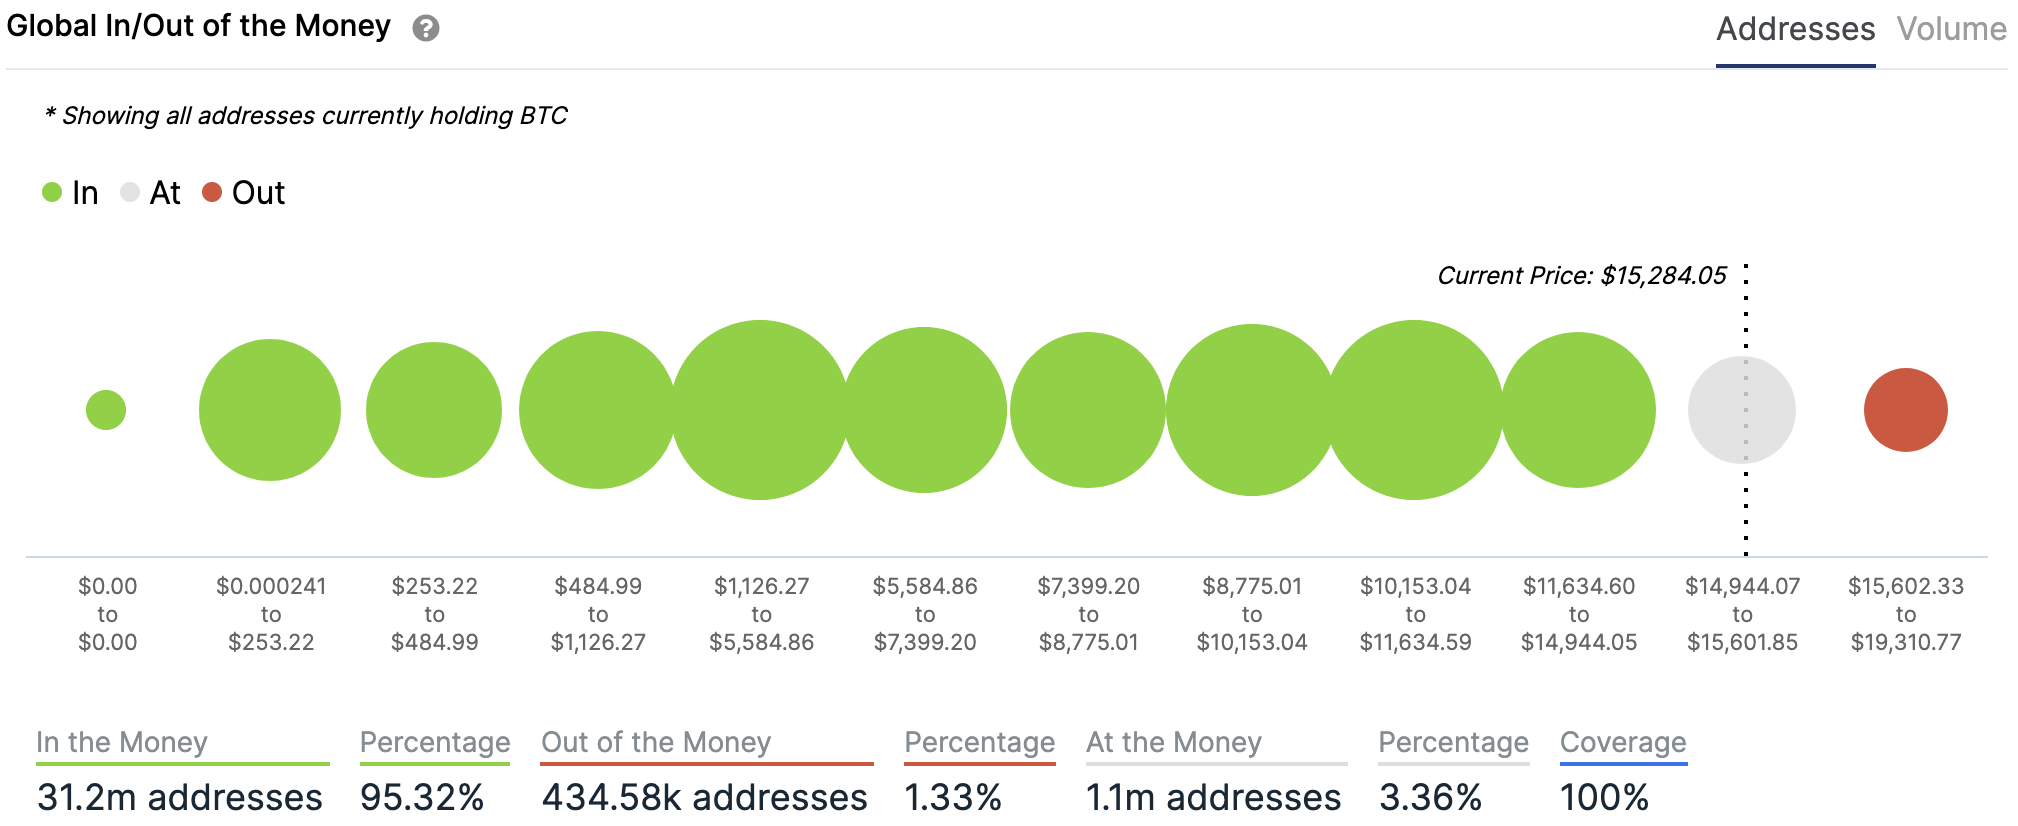
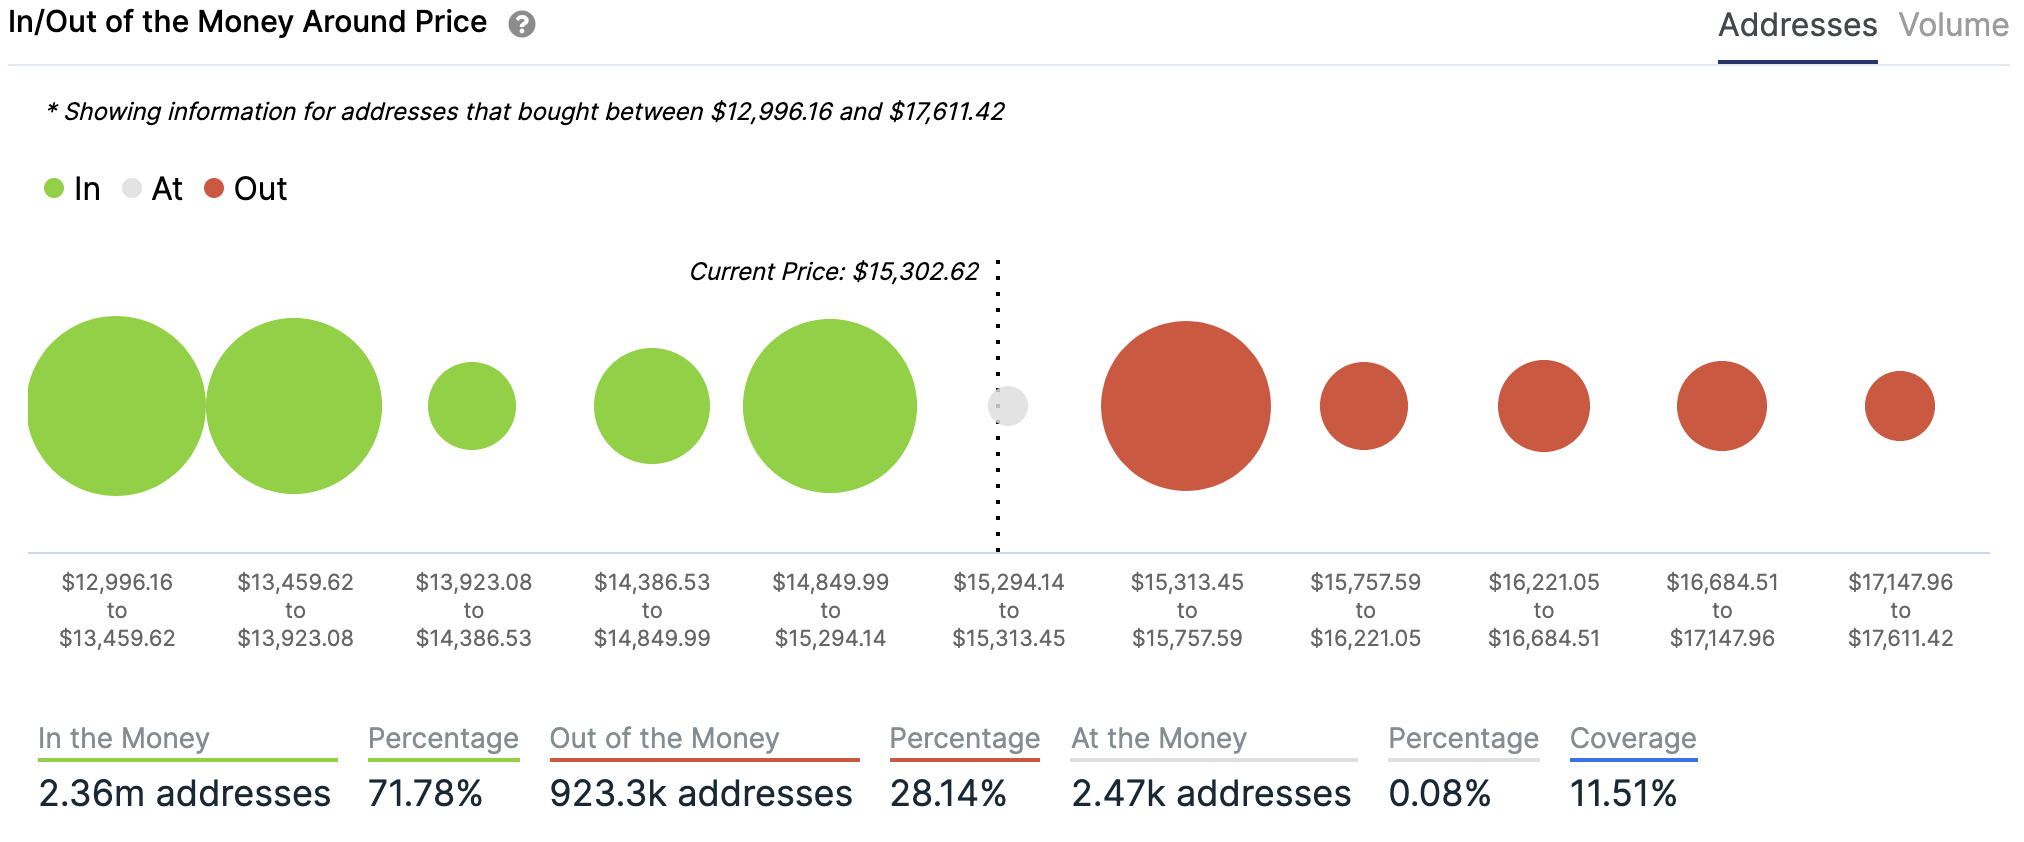
Charts provided by IntoTheBlock.com
Volatility
Annualised price volatility using 365 days.
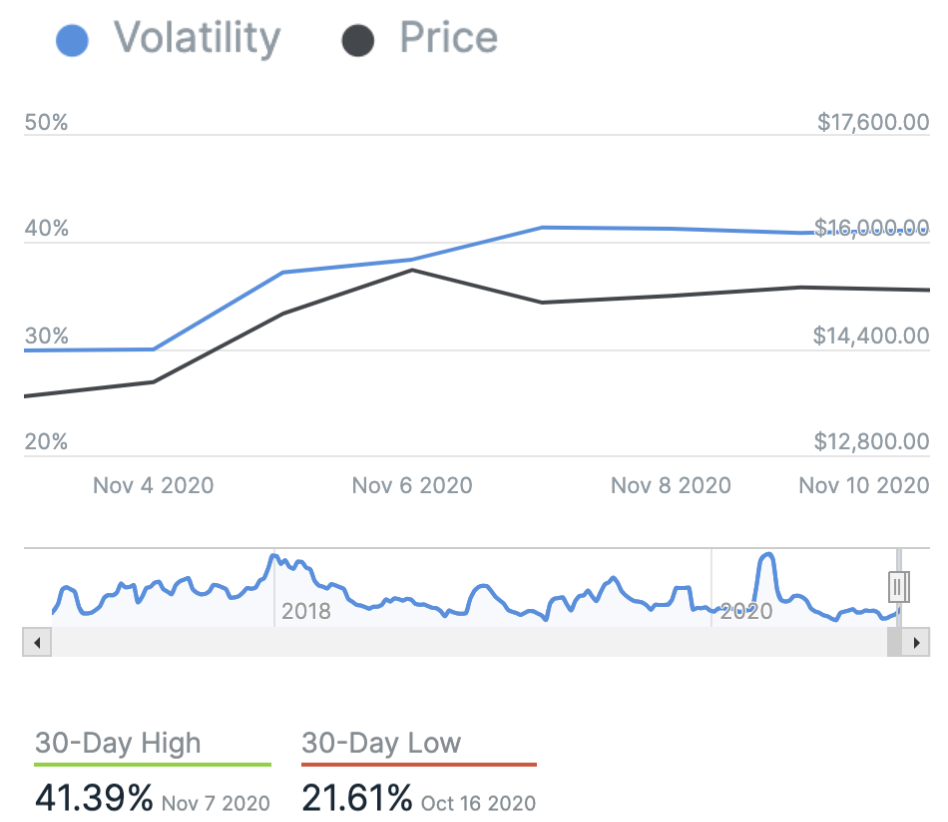
Charts provided by IntoTheBlock.com
Twitter sentiment
Yesterday, there were 11,600 tweets sent with a positive connotation towards bitcoin, 26,062 with a neutral connotation, and 1,764 were negative.
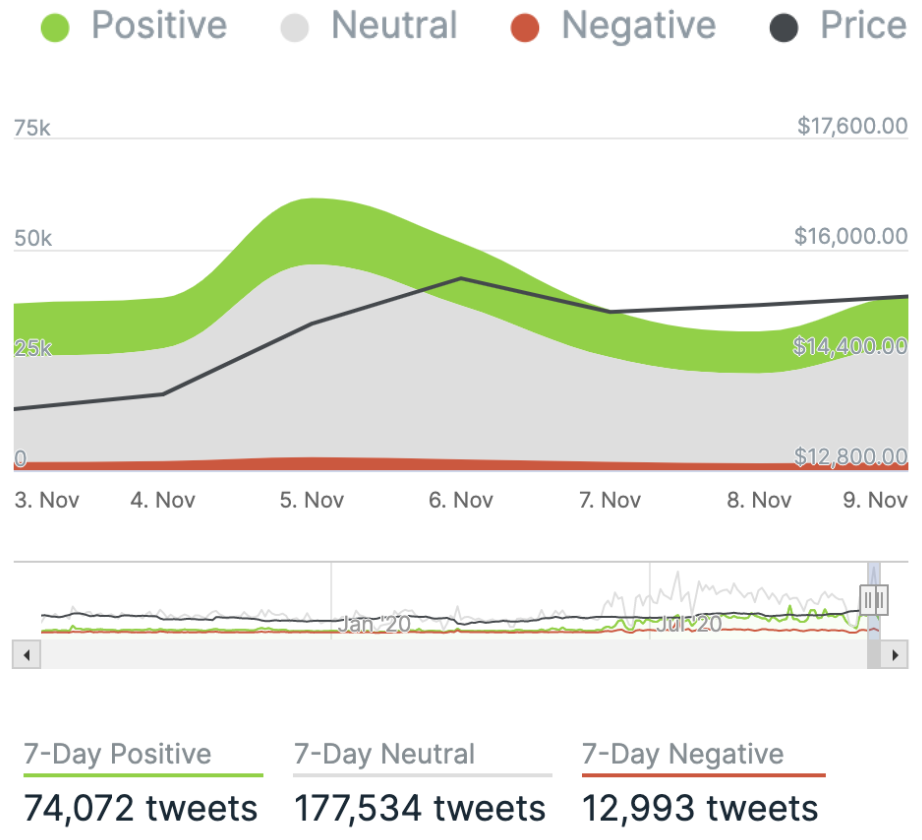
Charts provided by IntoTheBlock.com
Bitcoin’s market dominance
Bitcoin’s market dominance stands at 64.66. Its lowest recorded dominance was 37.09 on 8 January, 2018.
Relative Strength Index (RSI)
The daily RSI is currently 71.05. Values of 70 or above indicate that an asset is becoming overbought and may be primed for a trend reversal or experience a correction in price – an RSI reading of 30 or below indicates an oversold or undervalued condition.
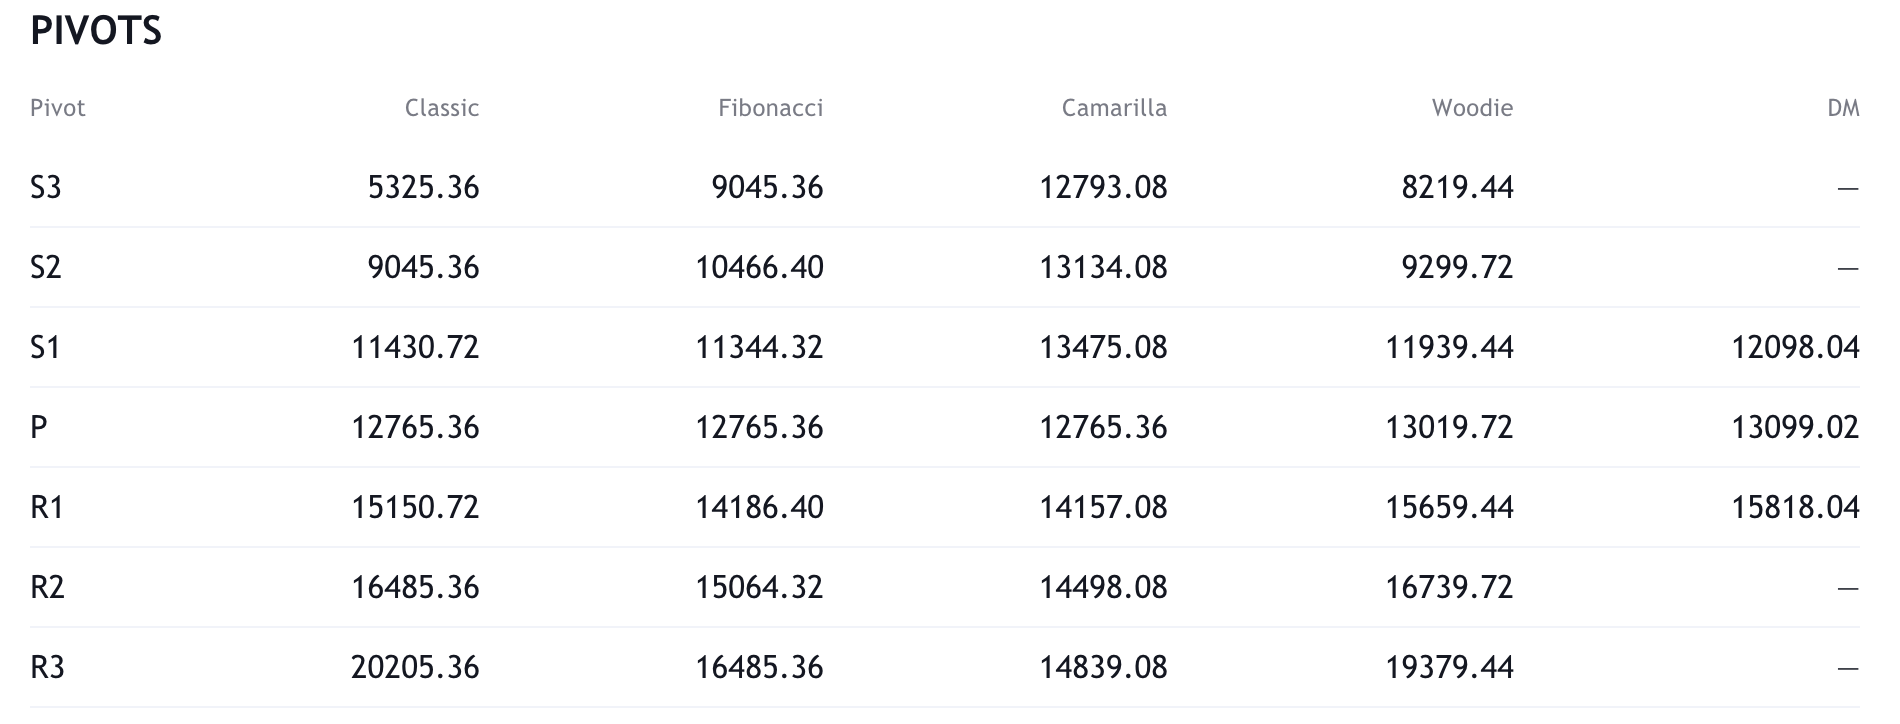
Resistance and support
What they said yesterday…
Today, #BTC was less volatile than NASDAQ, S&P 500, Dow Jones, Russell 2000, 10 & 30 Year Treasuries, Gold, Silver, Apple, Amazon, Microsoft, & Facebook. #Bitcoin advocates should stop apologizing for volatility.
— Michael Saylor (@michael_saylor) November 9, 2020
almost every morning we wake up to a new billionaire liking bitcoin. i like thishttps://t.co/SPrKkYPXW9
— Joseph Young (@iamjosephyoung) November 10, 2020
Visa, MasterCard and JP Morgan are the three largest financial institutions in the US by valuation. #Bitcoin will surpass all three of these in value when it hits 23k. Just let that sink in… ?
— Girl Gone Crypto (@girlgone_crypto) November 10, 2020
ETH 2.0 Scheduled for December, Vitalik Deposits $1.4M Worth of Ether Into Phase 0 Contract https://t.co/DRQBW7hgL1 pic.twitter.com/eYkj6GOiYU
— Bitcoin News (@BTCTN) November 7, 2020
What other data points would you like to see covered in our Daily Report? Let us know on Twitter.
Did you find this useful?