Discover
 Help Centre
 Status
 Company
 Careers
 Press
PressDaily market update: Bitcoin being treated as a ‘Primary Treasury Reserve Asset’

Welcome to your daily update of all Bitcoin’s price movements yesterday, including price, volume, the fear and greed index, and more.
If you’re new to the world of crypto trading, check out our beginner’s guide to trading series, featuring in-depth looks at common strategies, market analysis techniques, and more.
The content of this article is for information purposes only and is not investment advice or any form of recommendation or invitation. Luno always advises you to obtain your own independent financial advice before investing or trading in cryptocurrency.
Bitcoin Price
We closed yesterday, 11 August 2020, at a price of $11,410.53 – with a high of $11,932.71 and a low of $11,195.71.
It was the lowest closing price since 4 August 2020.
We’re still 43% below Bitcoin‘s all-time high of $20,089 (17 December 2017).
Market capitalisation
Bitcoin’s market capitalisation as of yesterday was $210,616,121,945. To put that into context, Jeff Bezos’s net worth is $188,500,000, which means he could only buy 85% of all Bitcoin. You can’t have everything, Jeff!
Bitcoin volume
The volume traded yesterday was $27,039,782,640. That’s the highest it’s been since 2 August 2020.
To put that into context, the highest ever 24-hour volume is $53,060,690,000, last year’s high was $29,060,690,000, and last year’s average was $15,060,690,000.
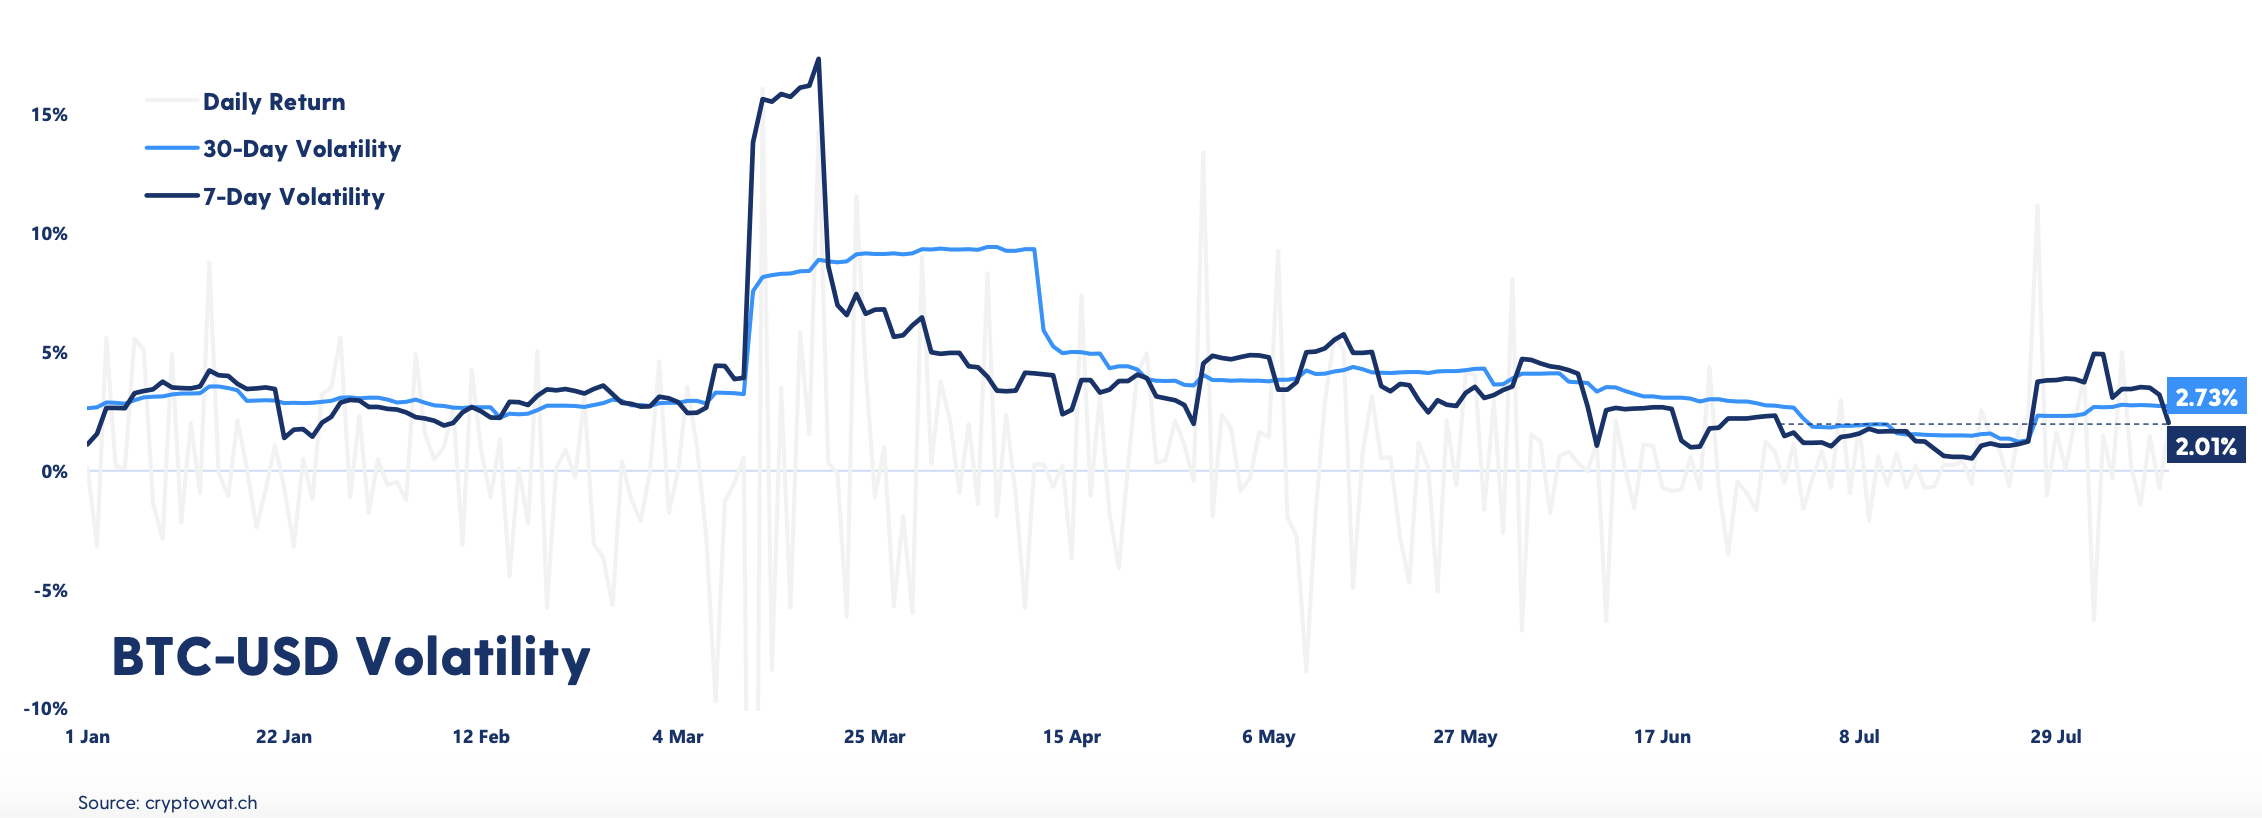
Bitcoin volatility decreases
The volatility has been dropping again for bitcoin lately. The 30-day volatility is once again above the 7-day volatility, after a fairly flat week for the leading cryptocurrency. However, we’re still above the extremely low volatility we saw during the first weeks of July.
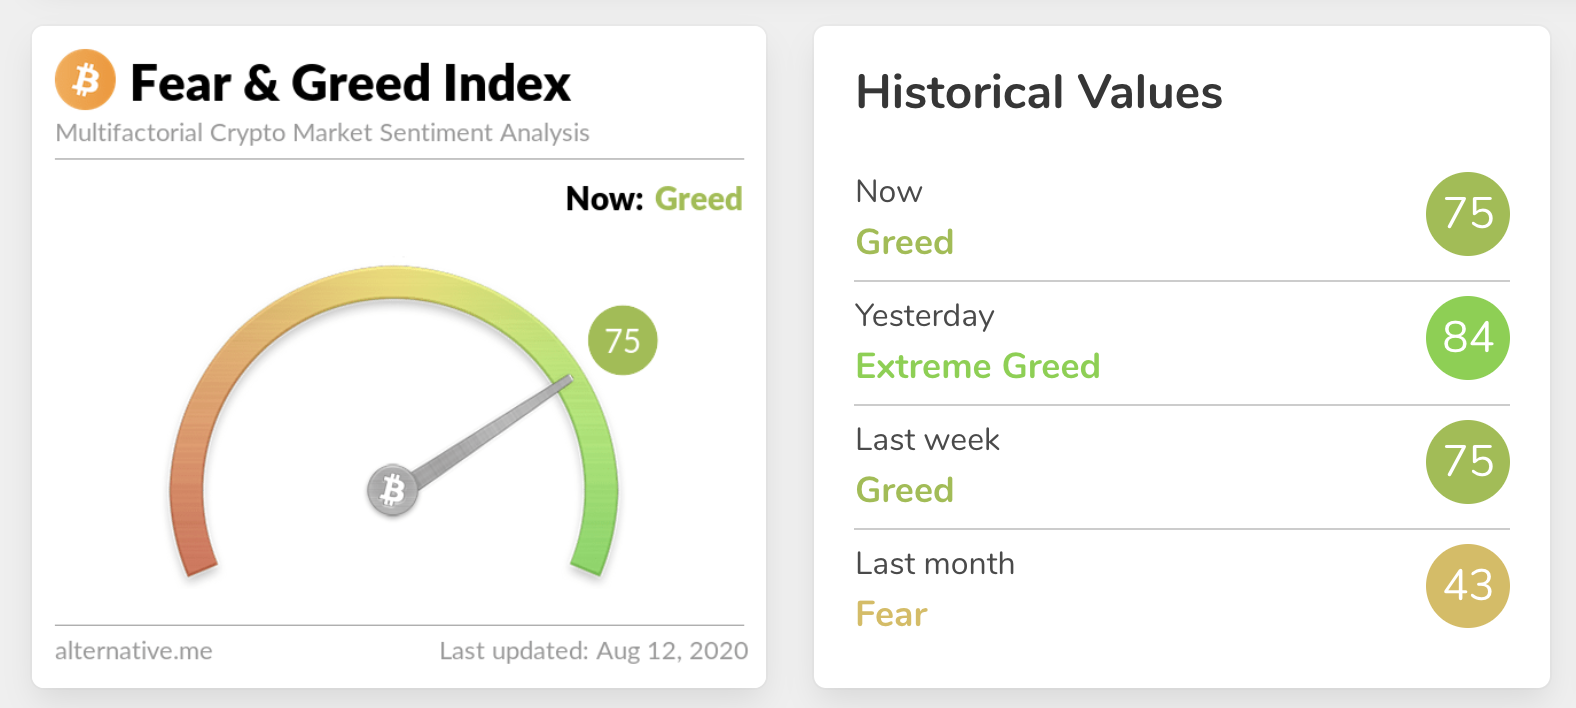
Fear and Greed Index
Cryptocurrency drops out of the Extreme Greed zone, but stays firmly in Greed with a fall from 84 to 75 – the lowest it’s been since 5 August 2020. Extreme fear can be a sign that investors are too worried, which could be a buying opportunity. When Investors are getting too greedy, that means the market may be due for a correction. With most coins doing well lately, it’s easy to get carried away. As highlighted last week, these “Extreme Greed” periods have been short-lived historically. Trade carefully.
Relative Strength Index (RSI)
The daily RSI is currently 60.07*. Values of 70 or above indicate that an asset is becoming overbought and may be primed for a trend reversal or experience correction in price. – an RSI reading of 30 or below indicates an oversold or undervalued condition.
*information correct as of 09:00 BST
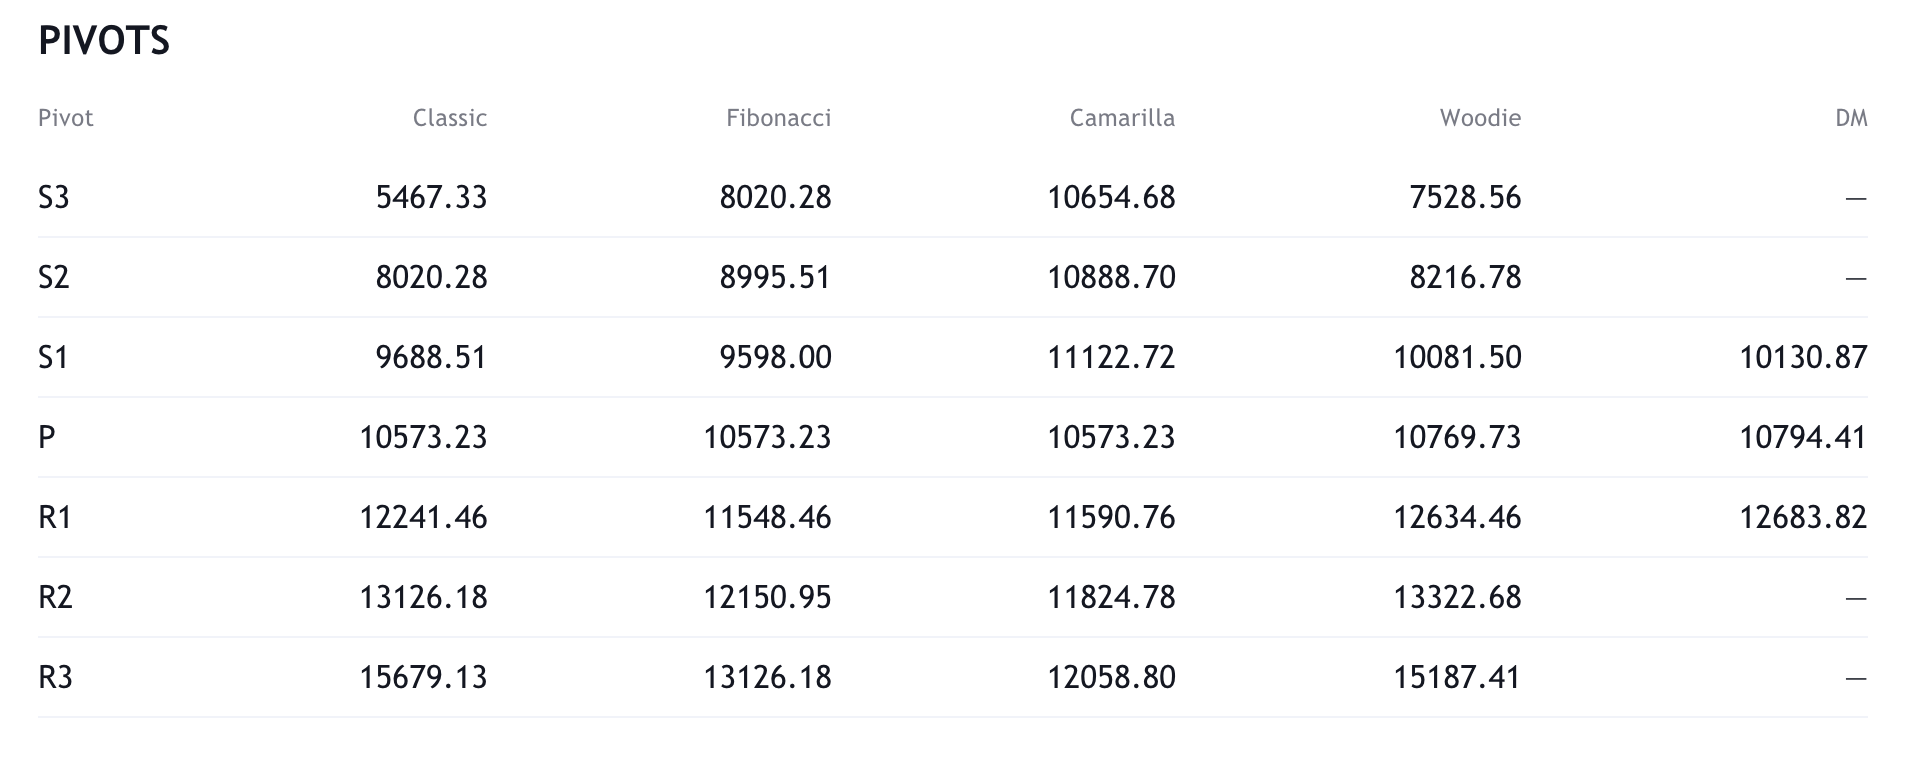
Resistance and Support
What they said yesterday..
MicroStrategy (a $billion company) has accumulated 21,454 BTC and refers to it as ‘Primary Treasury Reserve Asset’ …
… let that sink in
— Alistair Milne (@alistairmilne) August 11, 2020
People ask me all the time if it’s too late to buy #Bitcoin. I tell them that it’s the bottom of the first inning and that one day they’ll look back and understand just how early it is.
— Tyler Winklevoss (@tylerwinklevoss) August 11, 2020
Endless oceans of fiat.
21 million bitcoin.— hodlonaut ?⚡? (@hodlonaut) August 11, 2020
What other data points would you like to see covered in our Daily Report? Let us know on Twitter.
Did you find this useful?