Discover
 Help Centre
 Status
 Company
 Careers
 Press
PressDaily market update: Bitcoin decoupling from stock market?

It’s Friday! Here’s all your latest market updates. If you’re new to the world of crypto trading, take a look through our beginner’s guide to crypto trading series, starring in-depth explorations of common strategies, market analysis techniques, and more.
The content of this article is for information purposes only and is not investment advice or any form of recommendation or invitation. Luno always advises you to obtain your own independent financial advice before investing or trading in cryptocurrency.
All information is correct as of 09:00am GMT.
Bitcoin price
We closed yesterday, 29 October, 2020, at a price of $13,437.88, with a daily high of $13,612.05 and a low of $12,980.06.
We’re 33.11% below bitcoin‘s all-time high of $20,089 (17 December 2017).
As of today, buying bitcoin has been profitable for…
98.3% of all days since 2013-04-28.
Bitcoin volume
The volume traded yesterday was $56,499,499,598 – up from $35,867,318,895 the day before. That’s the highest daily trading volume since 8 October. High volume indicates that a significant price movement has stronger support and is more likely to be sustained.
Market capitalisation
Bitcoin’s market capitalisation as of yesterday was $248,995,322,466, up from $245,899,824,465 the day before. Let’s check in with Jeff Bezos again. He’s currently worth $187.8 billion. That means he could only afford to buy 75.42% of all bitcoin! Let’s all have a good laugh at Jeff’s misfortune.
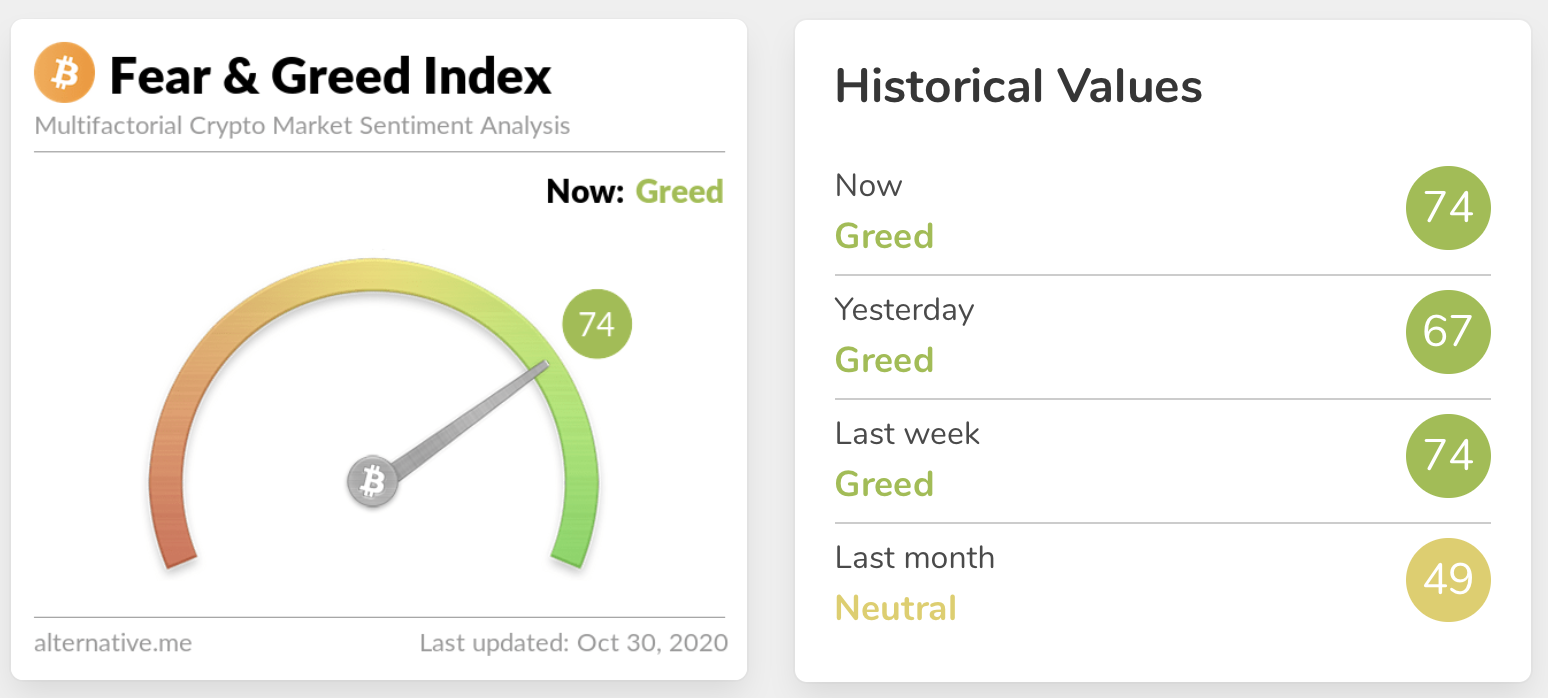
Fear and Greed Index
Mid 70s, how we’ve missed thee. Sentiment is back up to 74 – up from 67 the day before. Sentiment should obviously be at 100 year round because bitcoin is the best, but if we’re being technical, extreme fear can indicate that investors are getting too worried and there’s an opportunity for buyers, while extreme greed could mean the market is due for a correction.
Global in/out of the money
For any address with a balance of tokens, ITB identifies the average price (cost) at which those tokens were purchased and compares it with the current price. If the current price is higher than average cost, address is ‘In the Money’. If the current price is lower than the average cost, the address is ‘Out of the Money’.
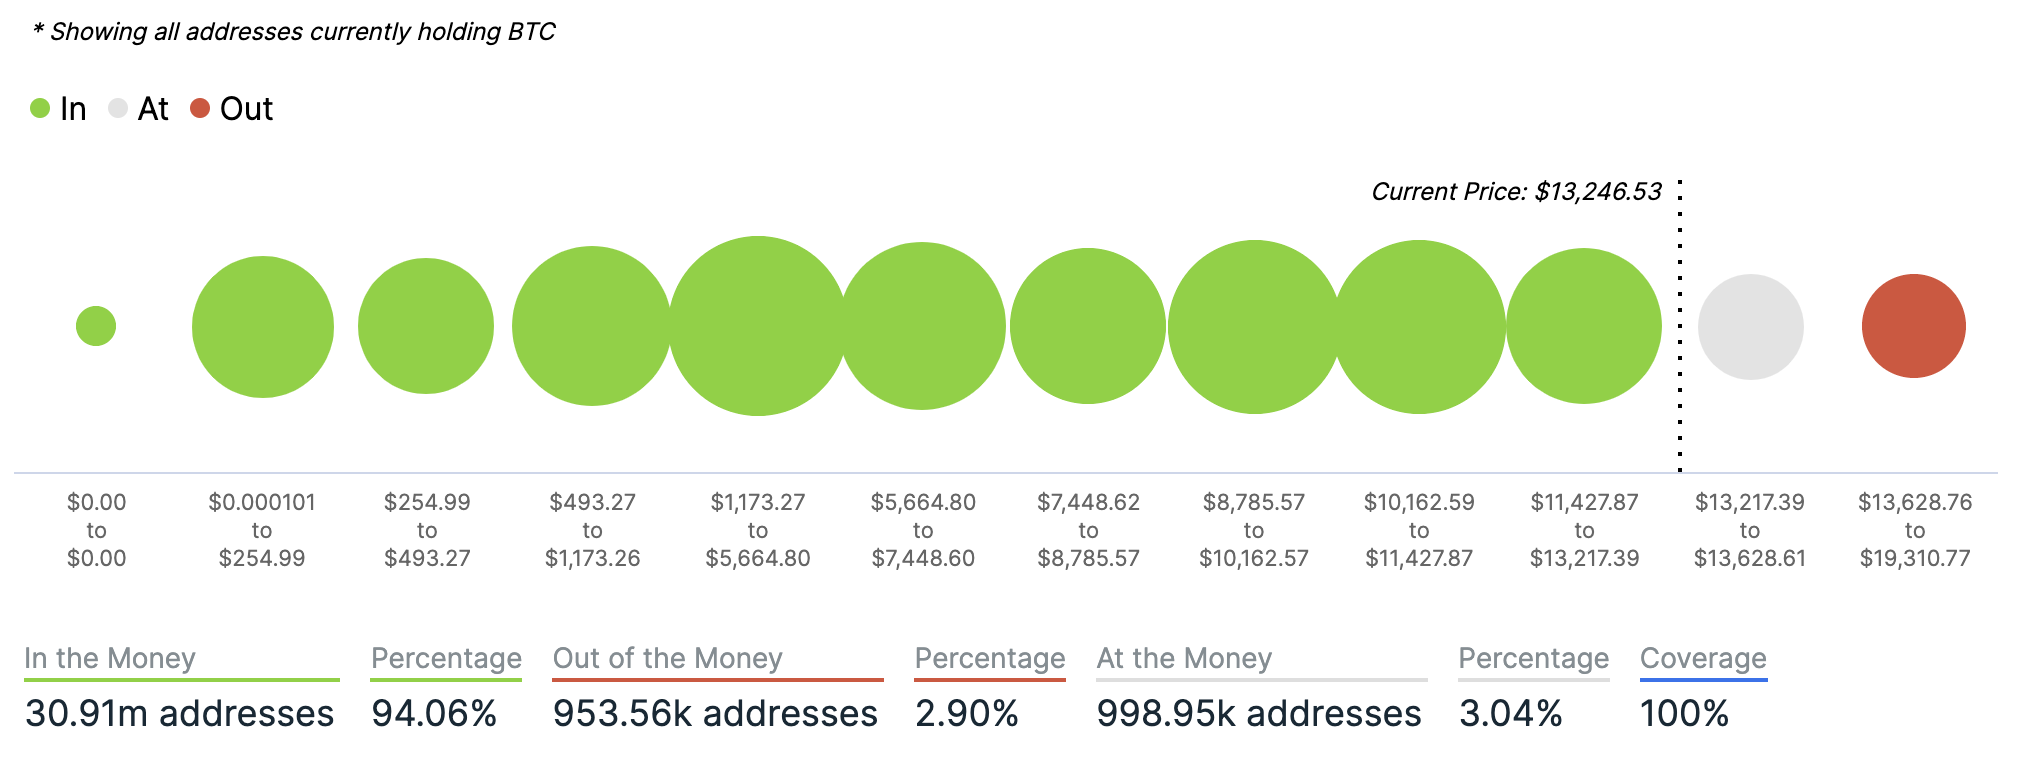
Chart provided by IntoTheBlock.com
Volatility
Annualised price volatility using 365 days.
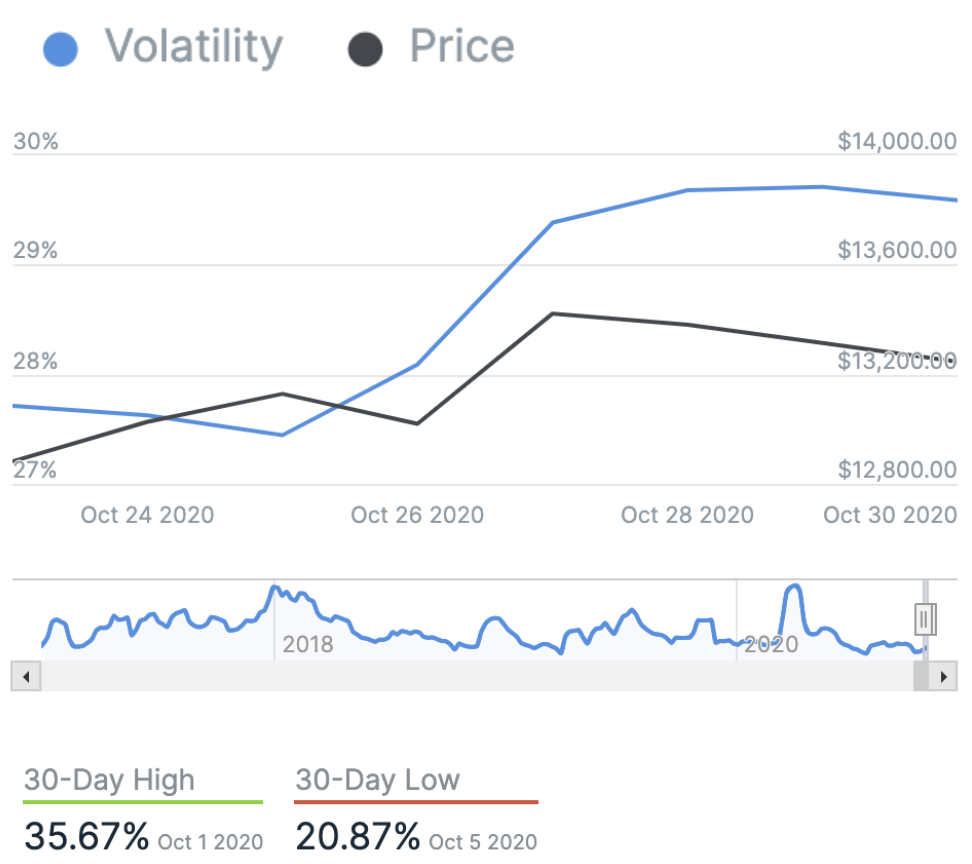
Chart provided by IntoTheBlock.com
Bitcoin’s market dominance
Bitcoin’s market dominance stands at 63.74. Its lowest recorded dominance was 37.09 on 8 January, 2018.
Relative Strength Index (RSI)
The daily RSI is currently 68.90. Values of 70 or above indicate that an asset is becoming overbought and may be primed for a trend reversal or experience correction in price – an RSI reading of 30 or below indicates an oversold or undervalued condition.
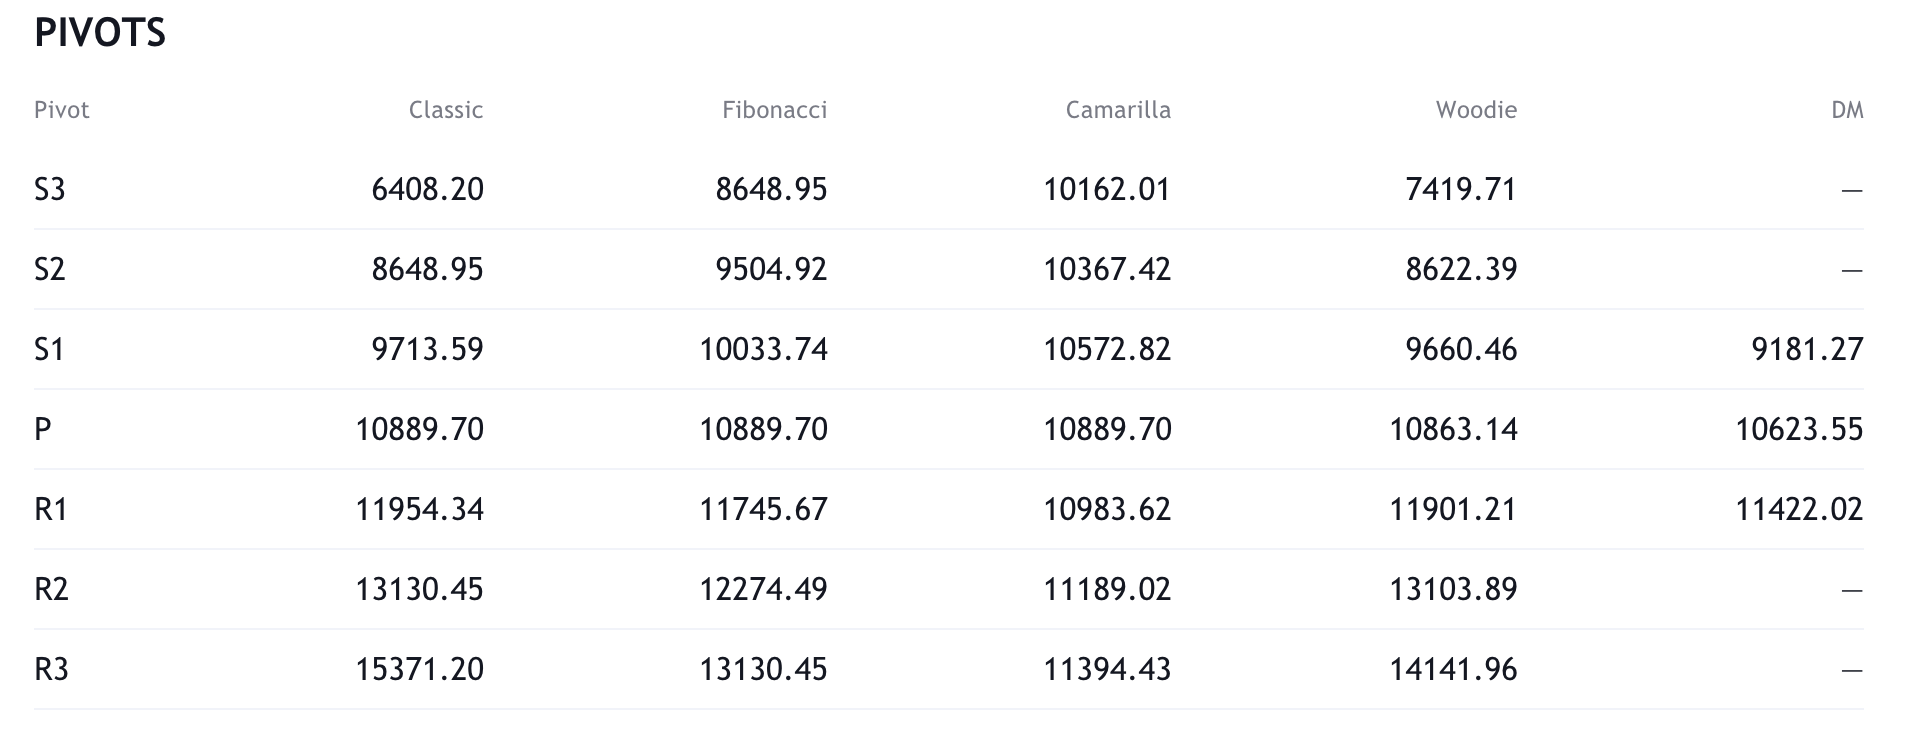
Resistance and support
What they said yesterday…
First signs of de-coupling behaviour spotted between BTC and stocks.
Buying from an influx of new users provides price support preventing speculators from trading the correlation downwards.
NVTP approximates a valuation for BTC with organic investor velocity on the blockchain. pic.twitter.com/AvilB9cfdD
— Willy Woo (@woonomic) October 29, 2020
BREAKING: Leaked ‘Tai Chi’ document reveals Binance’s elaborate scheme to evade bitcoin regulators: https://t.co/tt0ETF50i9 by @DelRayMan
— Forbes Crypto (@ForbesCrypto) October 29, 2020
#phase5
“[Iran][..] turning to #bitcoin, the 1st country to do so at a state level, with the famous bitcoin volatility less of a consideration here because the situation is desperate.”https://t.co/bEXxWZq7i9— PlanB (@100trillionUSD) October 29, 2020
Bitcoin advertising done right in Hong Kong ? pic.twitter.com/rlgLSnJE6N
— Bitcoin Magazine (@BitcoinMagazine) October 29, 2020
What other data points would you like to see covered in our Daily Report? Let us know on Twitter.
Did you find this useful?