Discover
 Help Centre
 Status
 Company
 Careers
 Press
PressDaily market update: Bitcoin dip seems to have been short lived, where to this week?

Did you manage to buy bitcoin under $18,000? When we left you last week, it seemed the bears were wrestling control. Thankfully, it appears the downward movement was short lived. But where to this week? Will the bears get another shot?
As always, here’s your daily market update to help you on your way. If you’re new to the world of crypto, take a look through our beginner’s guide to crypto trading series to get a better idea of all these indicators, starring in-depth explorations of common strategies, market analysis techniques, and more.
The content of this article is for information purposes only and is not investment advice or any form of recommendation or invitation. Luno always advises you to obtain your own independent financial advice before investing or trading in cryptocurrency.
All information is correct as of 10.00am GMT.
Bitcoin price
We closed yesterday, 29 November, 2020, at a price of $18,177.48 – up from 17,717.42 the day before. It’s now been 22 days since we closed under $15,000.
The daily high yesterday was $18,283.63, while the daily low was $17,559.12. This time last year, the price of bitcoin closed the day at $7,761.24 and in 2018 it was $4,278.85.
We’re 9.52% below bitcoin‘s all-time high of $20,089 (17 December 2017).
Bitcoin volume
The volume traded yesterday was $31,133,957,704, down from $32,601,040,734 the day before. High volumes can indicate that a significant price movement has stronger support and is more likely to be sustained.
Market capitalisation
Bitcoin’s market capitalisation as of yesterday was $337,336,592,123, up from $328,782,832,212 the day before. To put that into context, Mastercard’s market cap is currently $338 billion.
Fear and Greed Index
Sentiment remains in Extreme Greed at 88. The index has spent the entirety of November above important to note that the index doesn’t stay this high very often and a correction could be on the cards.
In/Out of the money
For any address with a balance of tokens, ITB identifies the average price (cost) at which those tokens were purchased and compares it with the current price. If the current price is higher than average cost, address is ‘In the Money’. If the current price is lower than the average cost, the address is ‘Out of the Money’.
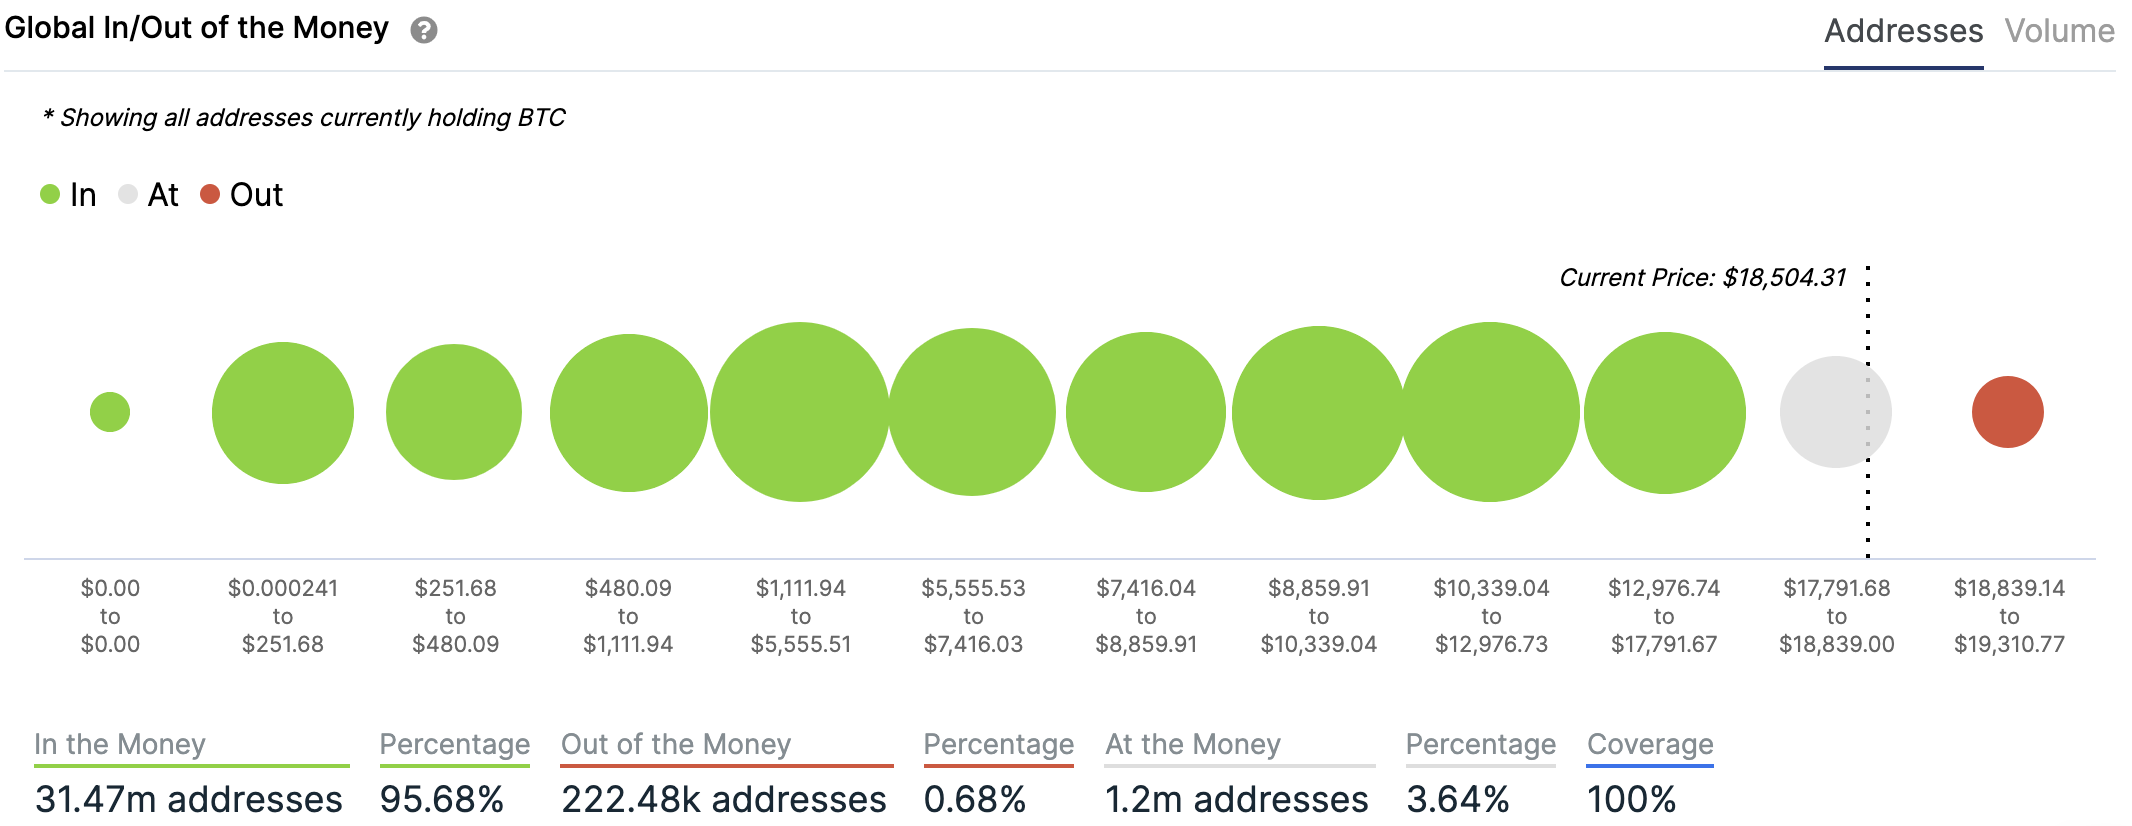
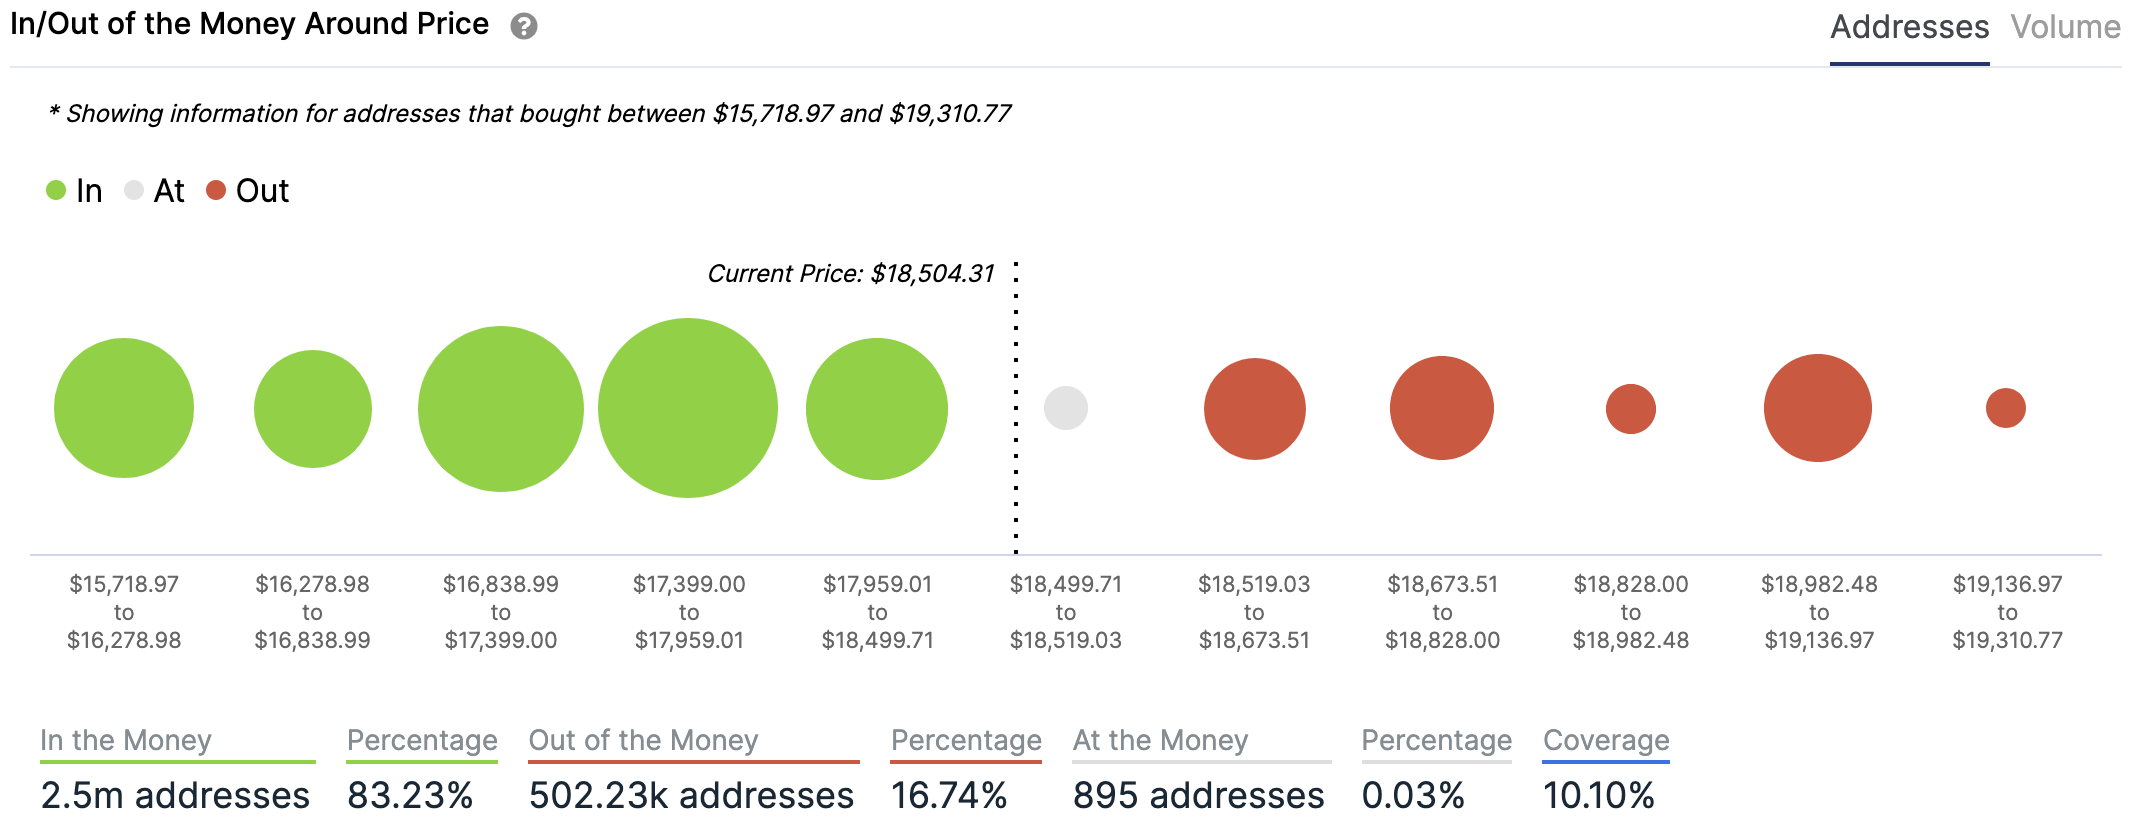
Charts provided by IntoTheBlock.com
Volatility
Annualised price volatility using 365 days.
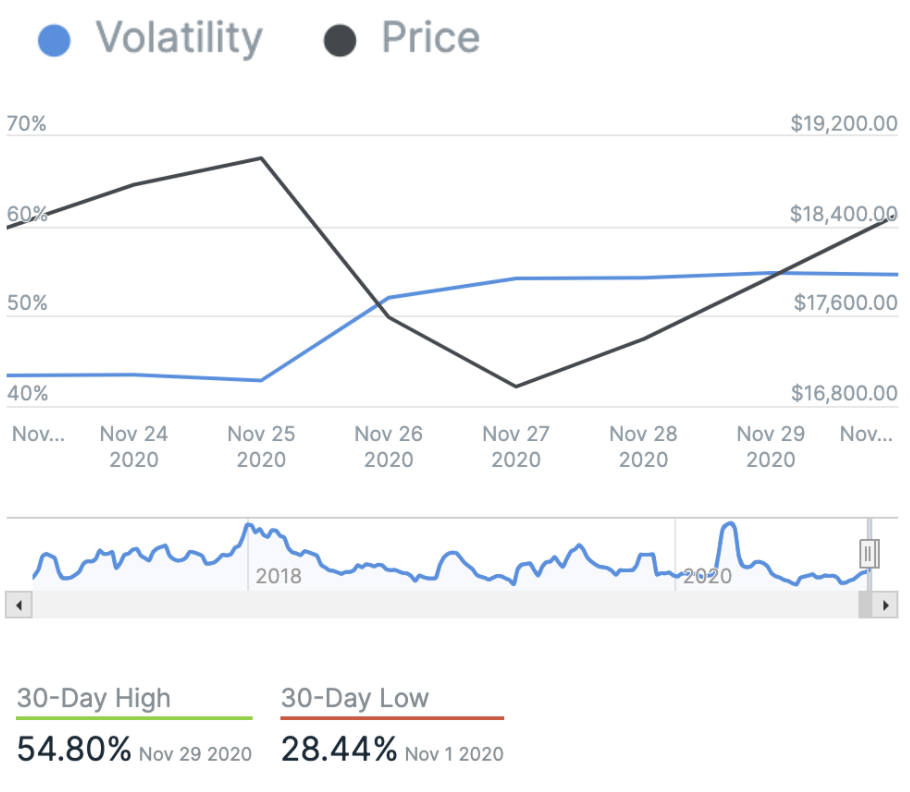
Charts provided by IntoTheBlock.com
Bitcoin’s market dominance
Bitcoin’s market dominance stands at 63.08. Its lowest recorded dominance was 37.09 on 8 January, 2018.
Relative Strength Index (RSI)
The daily RSI is currently 64.95. Values of 70 or above indicate that an asset is becoming overbought and may be primed for a trend reversal or experience a correction in price – an RSI reading of 30 or below indicates an oversold or undervalued condition.
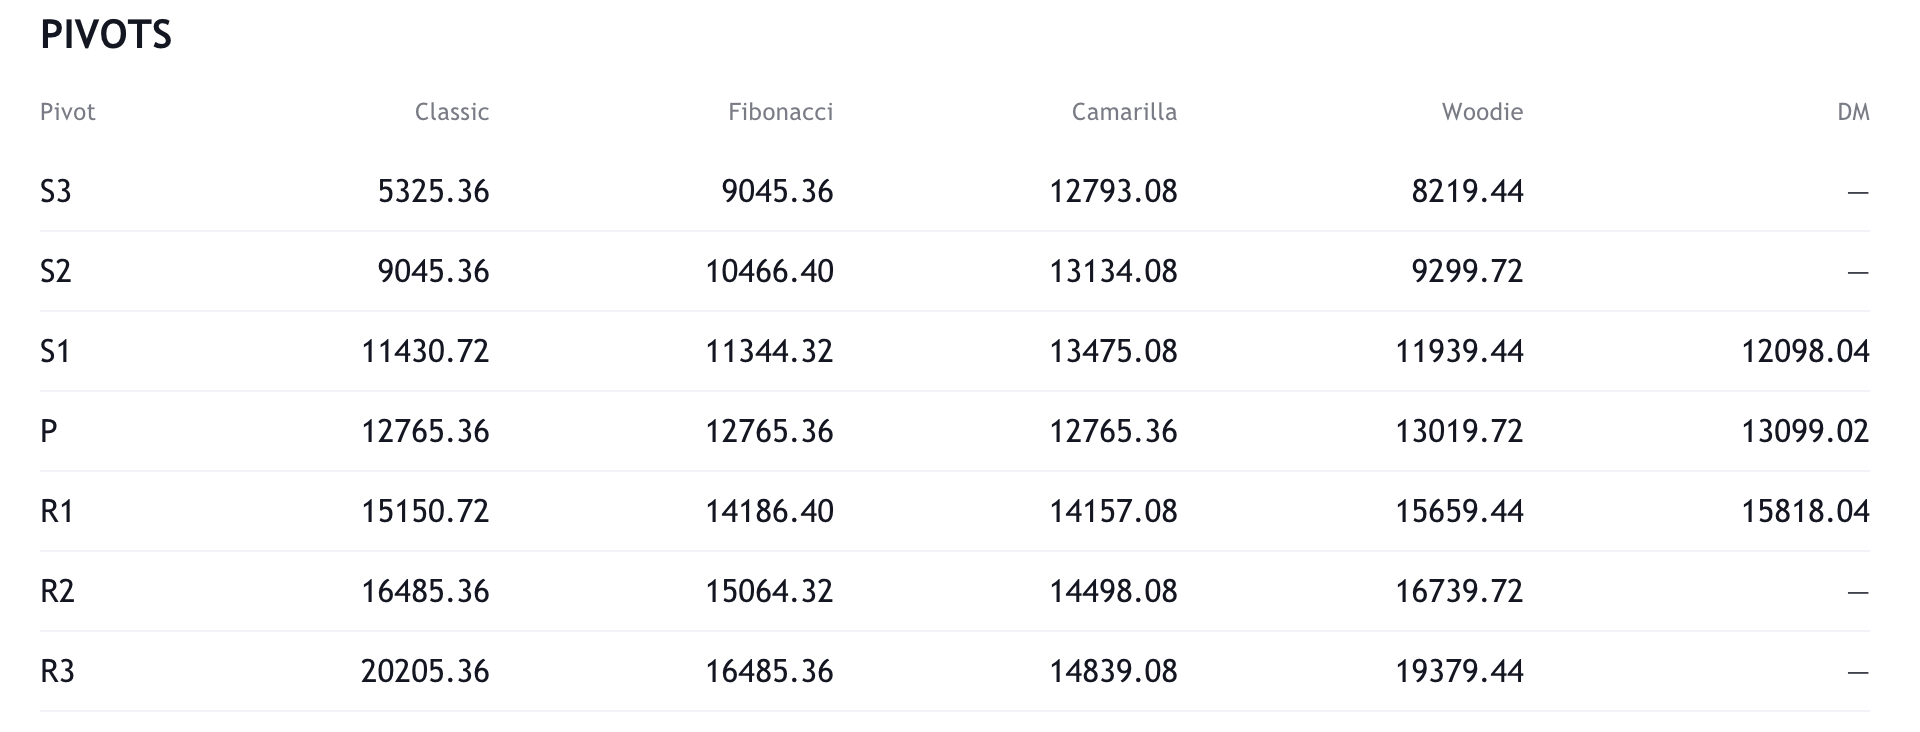
Resistance and support
What they said yesterday…
Guess the Black Friday bitcoin sale is officially over. Hope you stocked up
— Barry Silbert (@BarrySilbert) November 30, 2020
Tomorrow is Monday! Paypal, Grayscale, Square etc will resume buying #bitcoin. Are you ready? pic.twitter.com/kGx2g1pphF
— PlanB (@100trillionUSD) November 29, 2020
It is so early. #Bitcoin
7 Billion people to go. pic.twitter.com/tXWgY1YZmP
— 21e14 (@21e14) November 30, 2020
Russia to Recognize Bitcoin as Property With Legal Protection https://t.co/K0SYmtFlKs
— Bitcoin News (@BTCTN) November 30, 2020
What other data points would you like to see covered in our Daily Report? Let us know on Twitter.
Did you find this useful?