Discover
 Help Centre
 Status
 Company
 Careers
 Press
PressDaily market update: New all-time high reported for bitcoin – is $20,000 next?


There was excitement across the crypto-sphere yesterday as a number of sources, including Luno, declared a new all-time high for the bitcoin price. This wasn’t universal – for the purposes of this column we use the highest ever price of $20,089 on CoinMarketCap. But for the vast majority – including the likes of CoinDesk, which views the all-time high of bitcoin as $19,783 – we’re back at last.
The reason there’s not one universally-accepted all-time high is that there’s no standard or global Bitcoin price. Bitcoin isn’t pegged to anything to give it value. It’s worth what people are willing to pay for it, and people using different platforms are usually willing to pay different amounts. The crypto market isn’t centralised in the same way that stock exchanges are. Bitcoin prices vary depending on the exchange they’re trading on, based on factors such as liquidity and delays moving funds. Find out more here.
As always, here’s your daily market update to help you on your way. If you’re new to the world of crypto, take a look through our beginner’s guide to crypto trading series to get a better idea of all these indicators, starring in-depth explorations of common strategies, market analysis techniques, and more.
The content of this article is for information purposes only and is not investment advice or any form of recommendation or invitation. Luno always advises you to obtain your own independent financial advice before investing or trading in cryptocurrency.
All information is correct as of 07.30am GMT.
Bitcoin price
We closed yesterday, 30 November, 2020, at a price of $19,625.84 – up from $18,177.48 the day before. That’s the highest price bitcoin has ever closed at (by any estimates).
The daily high yesterday was $19,749.26 while the daily low was $18,178.32. This time last year, the price of bitcoin closed the day at $7,569.63 and in 2018 it was $4,017.27.
We’re 2.31% below bitcoin‘s all-time high on CoinMarketCap of $20,089 (17 December 2017).
Bitcoin volume
The volume traded yesterday was $47,728,480,399, up from $31,133,957,704 the day before. High volumes can indicate that a significant price movement has stronger support and is more likely to be sustained.
Market capitalisation
Bitcoin’s market capitalisation as of yesterday was $364,229,729,426, up from $337,336,592,123, the day before. To put that into context, Procter & Gamble’s market cap is $343.92 billion.
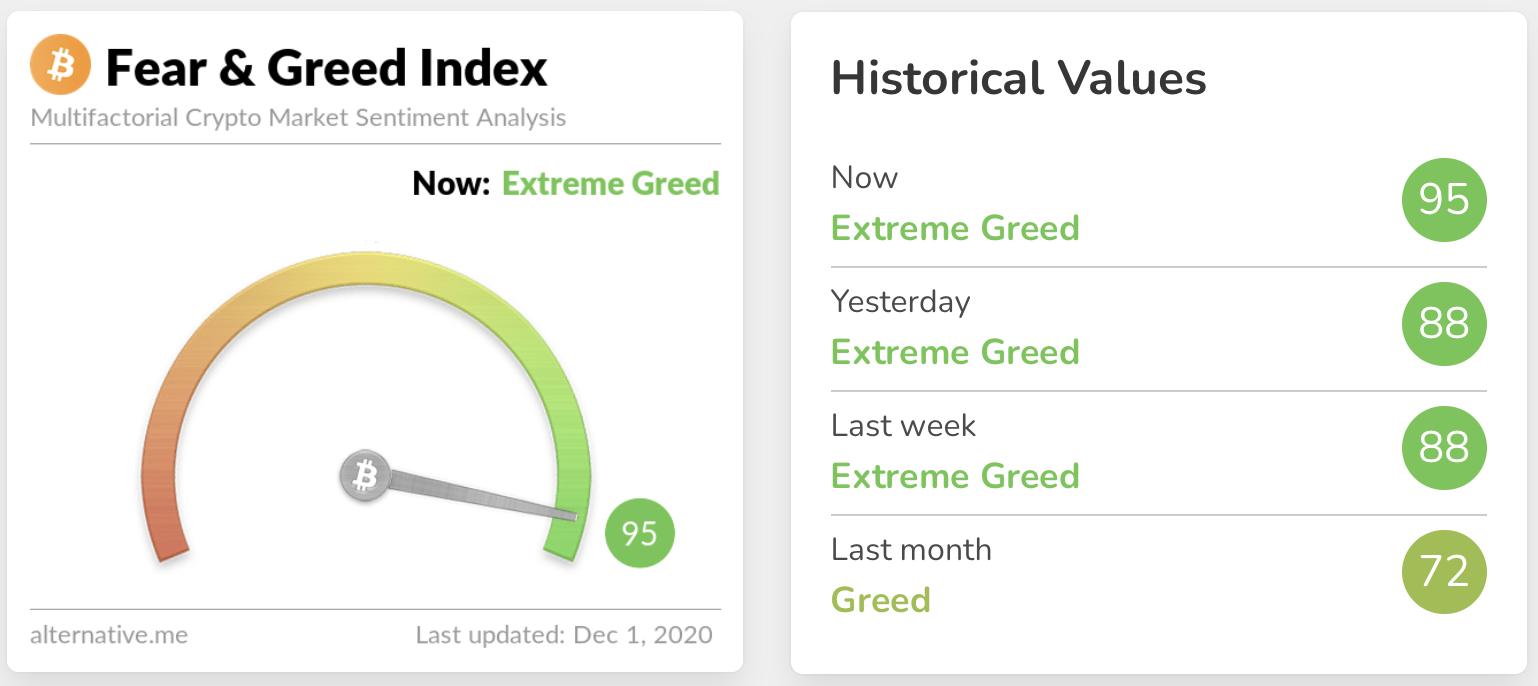
Fear and Greed Index
Sentiment remains in Extreme Greed at 95. That’s the joint highest recorded score since the index began. The index spent the entirety of November above 70. It’s important to note that the index doesn’t stay this high very often and a correction could be on the cards. We have been saying that a while though.
In/Out of the money
For any address with a balance of tokens, ITB identifies the average price (cost) at which those tokens were purchased and compares it with the current price. If the current price is higher than average cost, address is ‘In the Money’. If the current price is lower than the average cost, the address is ‘Out of the Money’.
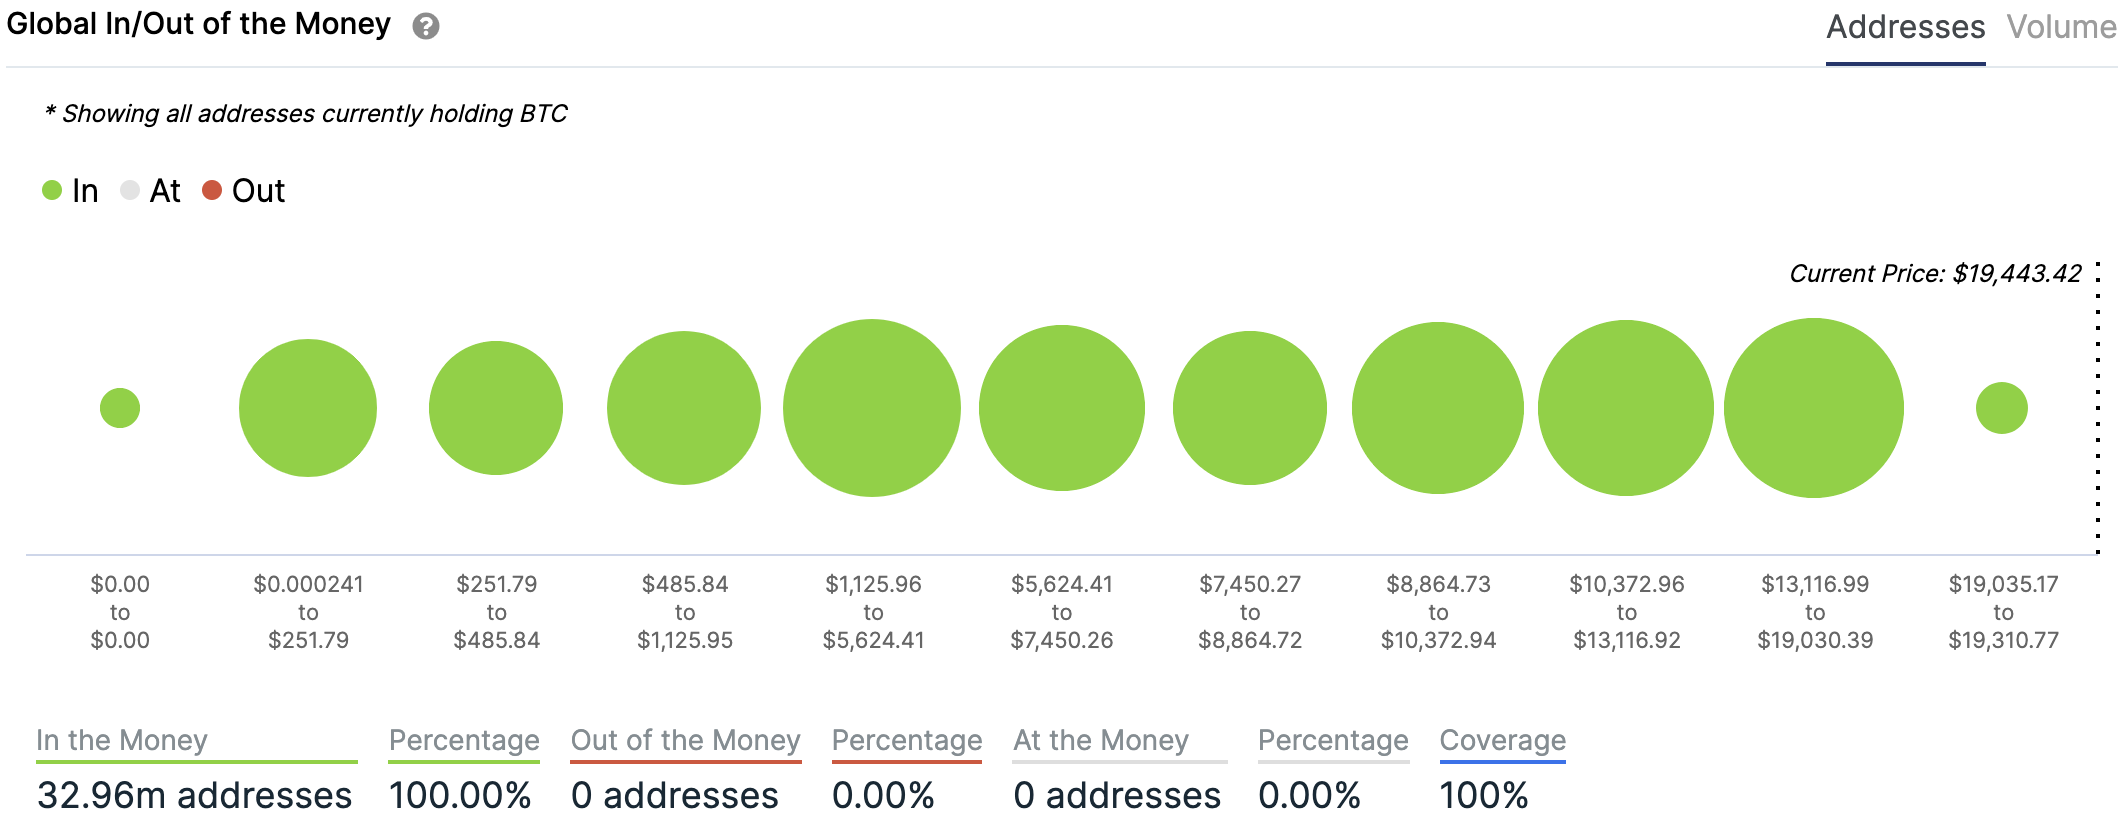
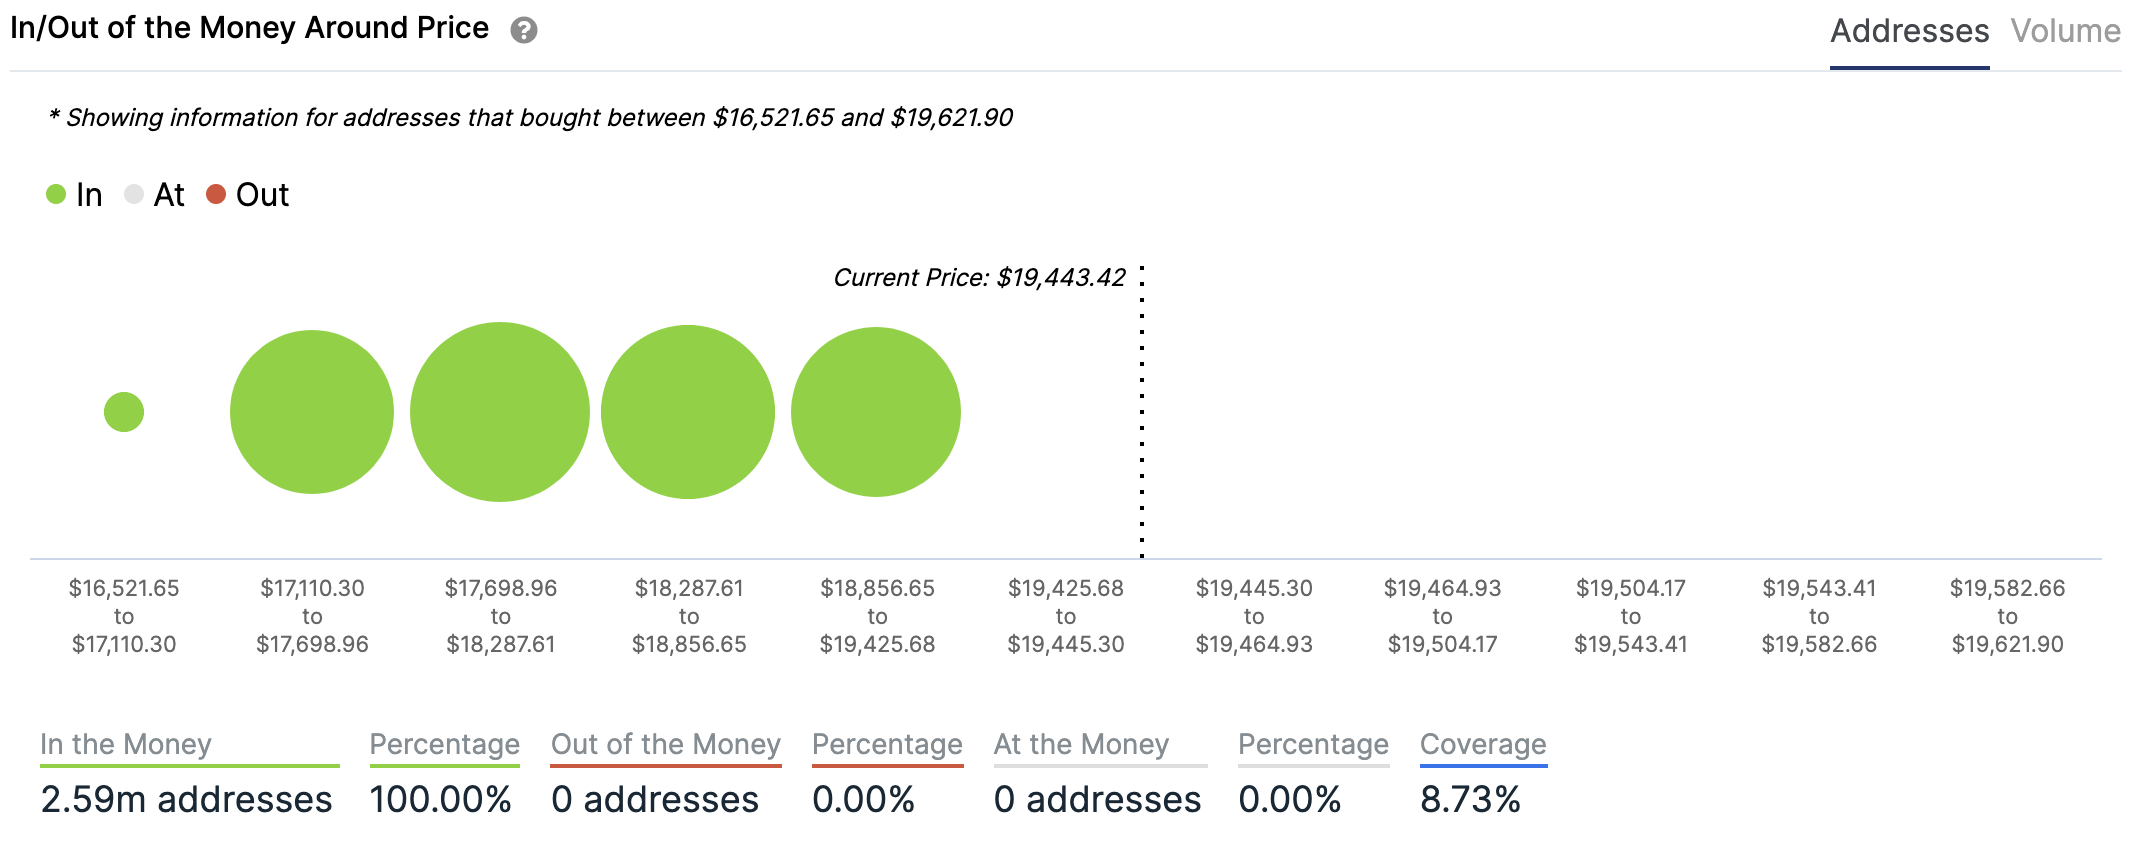
Charts provided by IntoTheBlock.com
Volatility
Annualised price volatility using 365 days.
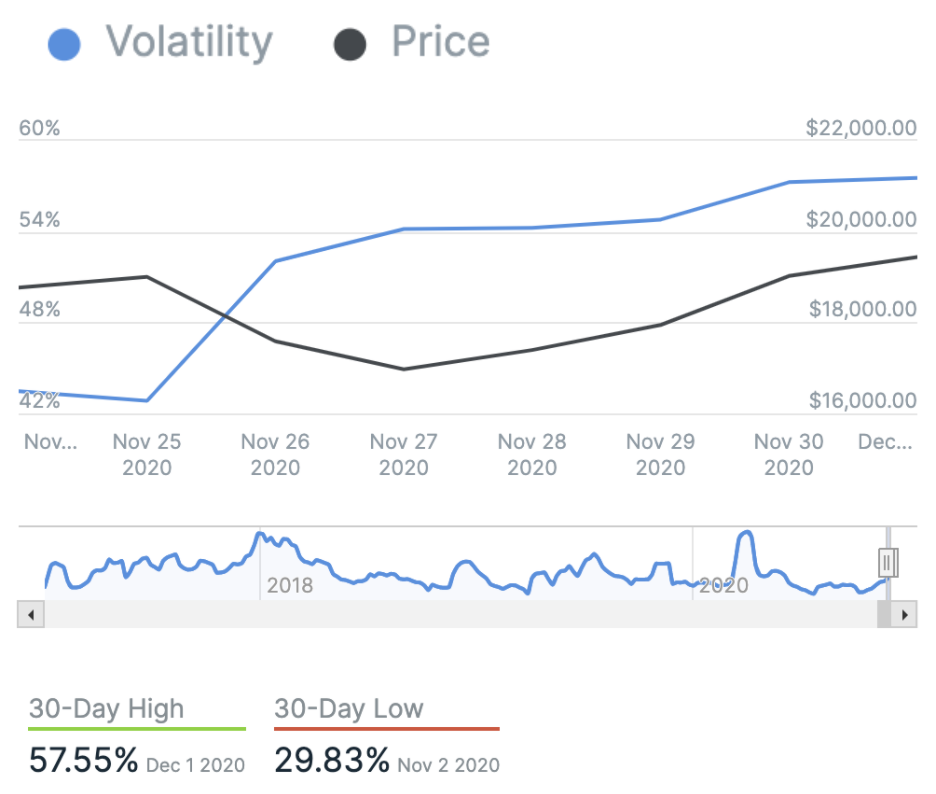
Charts provided by IntoTheBlock.com
Bitcoin’s market dominance
Bitcoin’s market dominance stands at 63.11. Its lowest recorded dominance was 37.09 on 8 January, 2018.
Relative Strength Index (RSI)
The daily RSI is currently 68.30. Values of 70 or above indicate that an asset is becoming overbought and may be primed for a trend reversal or experience a correction in price – an RSI reading of 30 or below indicates an oversold or undervalued condition.
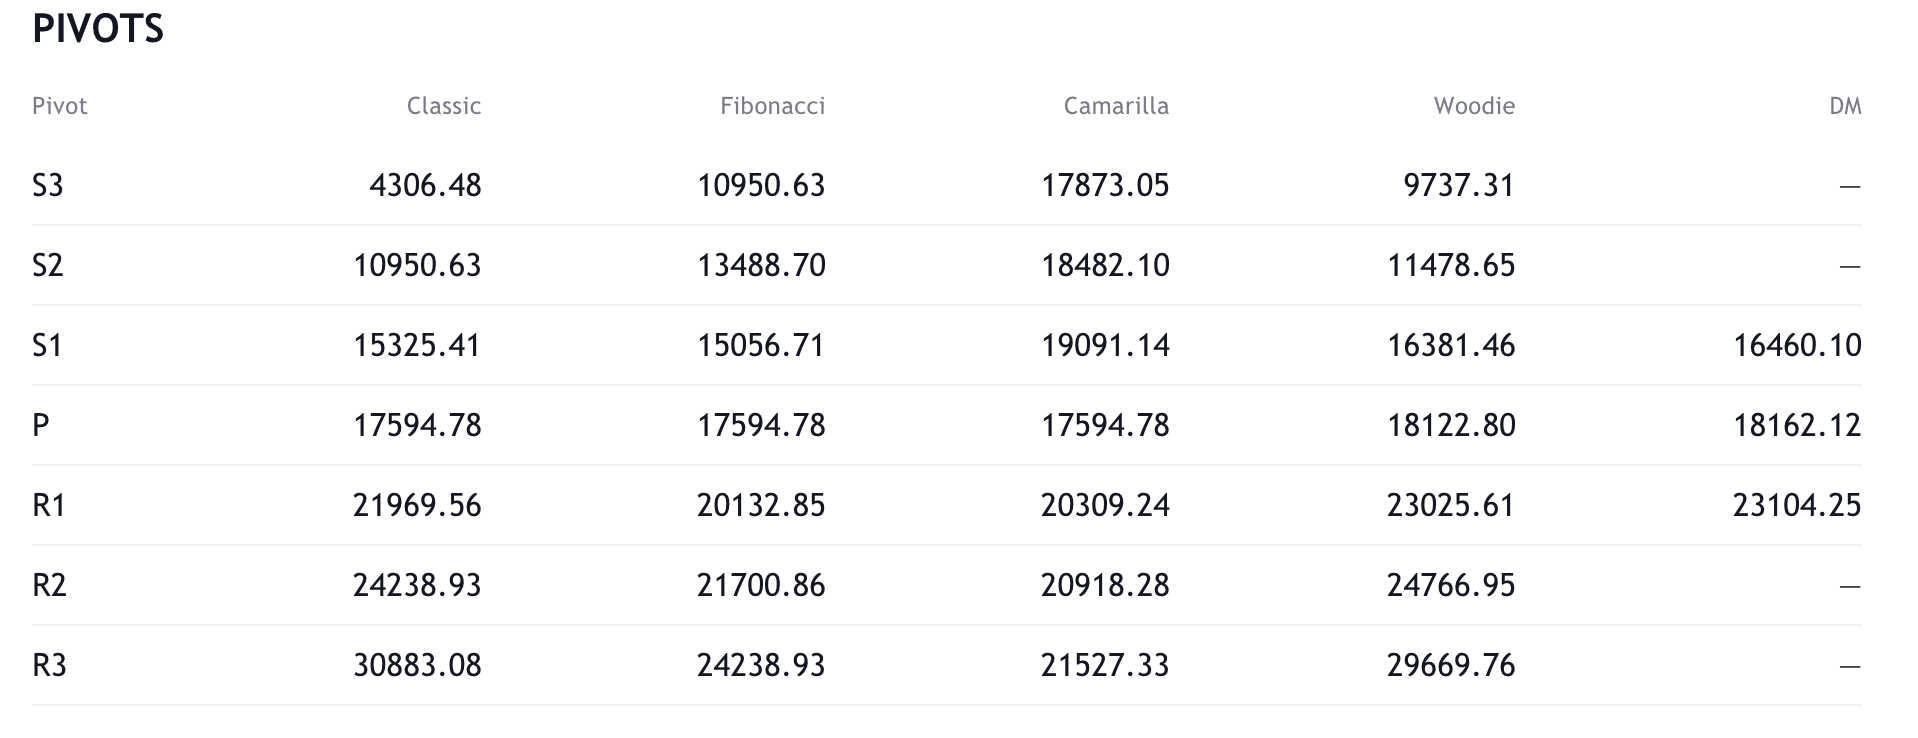
Resistance and support
What they said yesterday…
Here we go. Here we go again. ? pic.twitter.com/9QjGXPvHnB
— Bitcoin (@Bitcoin) November 30, 2020
#Bitcoin just hit an all-time high! Onward and upward we go to the moon! ? pic.twitter.com/CfyuBAelZZ
— Tyler Winklevoss (@tyler) November 30, 2020
It’s starting to turn into a stampede for #Bitcoin.
Bernstein suggests a 1.5-10% allocation for #btc. Huge.
Respected Wall St equity research house changes mind.
Hard for asset allocaters not to pay attention to drumbeat of positives from institutions.https://t.co/qW0TlGGDXT
— Dan Tapiero (@DTAPCAP) December 1, 2020
Over the Thanksgiving holiday weekend, #Bitcoin operated uninterrupted for 113.5 hours vs. 3.5 hours for US capital markets. Networks from Google, Apple, Facebook, & Amazon also operated uninterrupted. No one is going to settle for 3.1% availability from their monetary network.
— Michael Saylor (@michael_saylor) November 30, 2020
What other data points would you like to see covered in our Daily Report? Let us know on Twitter.
Did you find this useful?