Discover
 Help Centre
 Status
 Company
 Careers
 Press
PressDaily market update: Bitcoin is gold competitor, says JP Morgan

Yesterday saw bitcoin’s highest weekly close since January 2018. Is $14,000 in sight this week?
The content of this article is for information purposes only and is not investment advice or any form of recommendation or invitation. Luno always advises you to obtain your own independent financial advice before investing or trading in cryptocurrency.
All information is correct as of 07:30am BST.
Bitcoin price
We closed yesterday, 25 October, 2020, at a price of $13,031.17 with a daily high of $13,329.18 and a low of $12,910.06. That’s the highest price since 16 January 2018.
We’re 35.13% below bitcoin‘s all-time high of $20,089 (17 December 2017).
As of today, buying bitcoin has been profitable for…
98.2% of all days since 2013-04-28.
Bitcoin volume
The volume traded yesterday was $24,406,920,575 – down from $24,542,317,940 the day before. That’s the highest daily trading volume since 11 September. High volume indicates that a significant price movement has stronger support and is more likely to be sustained.
Market capitalisation
Bitcoin’s market capitalisation as of yesterday was $241,425,217,440, down from $242,839,876,186 the day before.
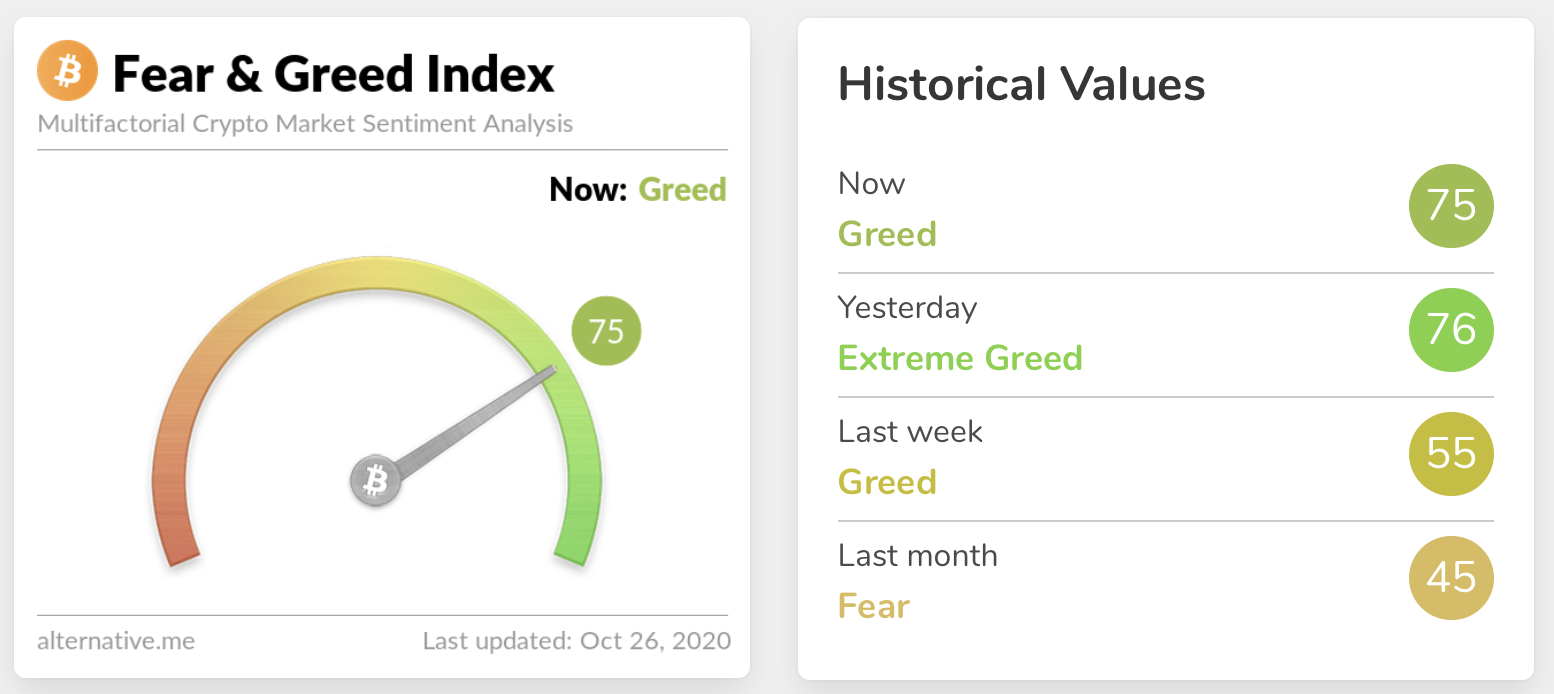
Fear and Greed Index
Is greed good? We remain firmly in the green, albeit down from 76 on Saturday to 75 yesterday. Extreme fear can be a sign that investors are too worried, which could be a buying opportunity. When Investors are getting too greedy, that means the market may be due for a correction.
Global In/Out of the money
For any address with a balance of tokens, ITB identifies the average price (cost) at which those tokens were purchased and compares it with the current price. If the current price is higher than average cost, address is ‘In the Money’. If the current price is lower than the average cost, the address is ‘Out of the Money’.
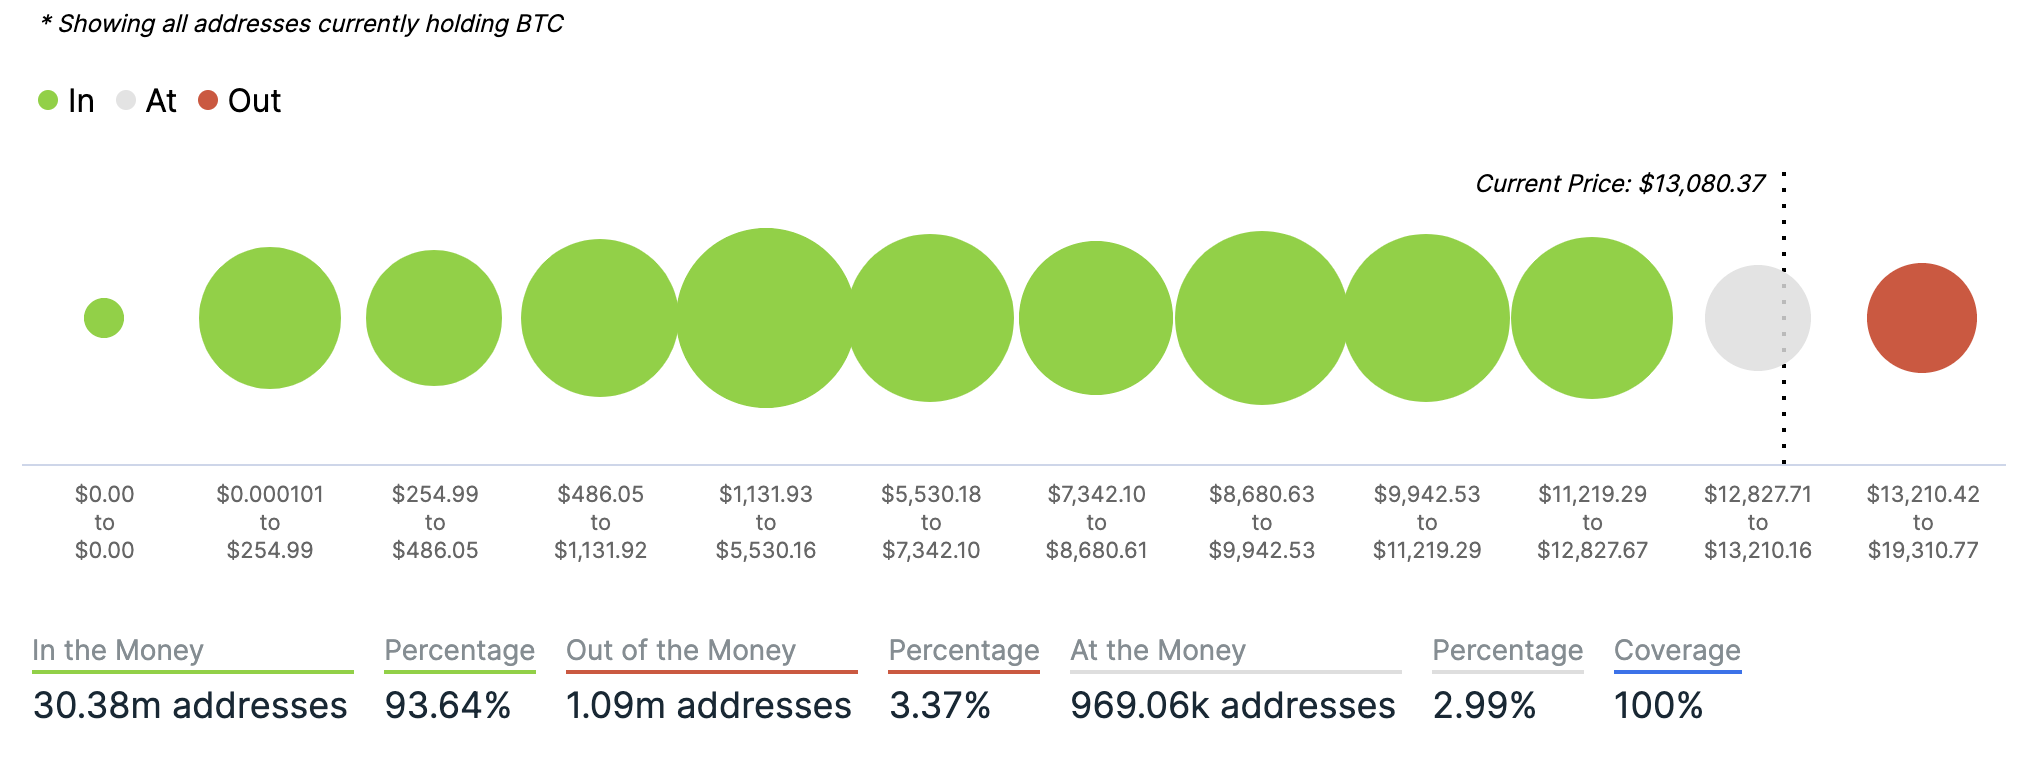
Chart provided by IntoTheBlock.com
Volatility
Annualised price volatility using 365 days.
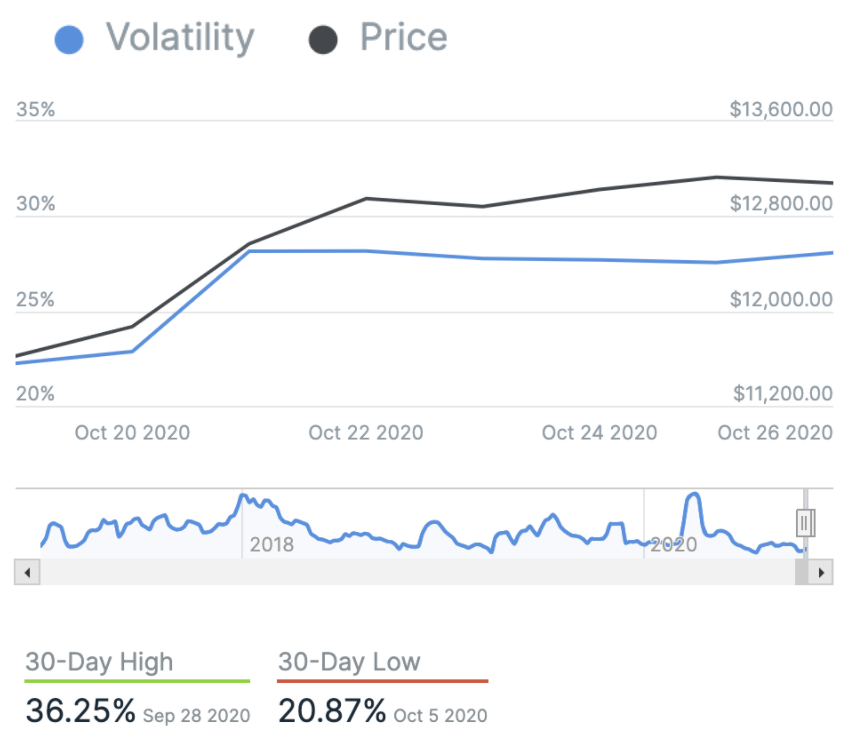
Chart provided by IntoTheBlock.com
Bitcoin’s market dominance
Bitcoin’s market dominance stands at 61.92. Its lowest recorded dominance was 37.09 on 8 January, 2018.
Relative Strength Index (RSI)
The daily RSI is currently 78.69. Values of 70 or above indicate that an asset is becoming overbought and may be primed for a trend reversal or experience correction in price – an RSI reading of 30 or below indicates an oversold or undervalued condition.
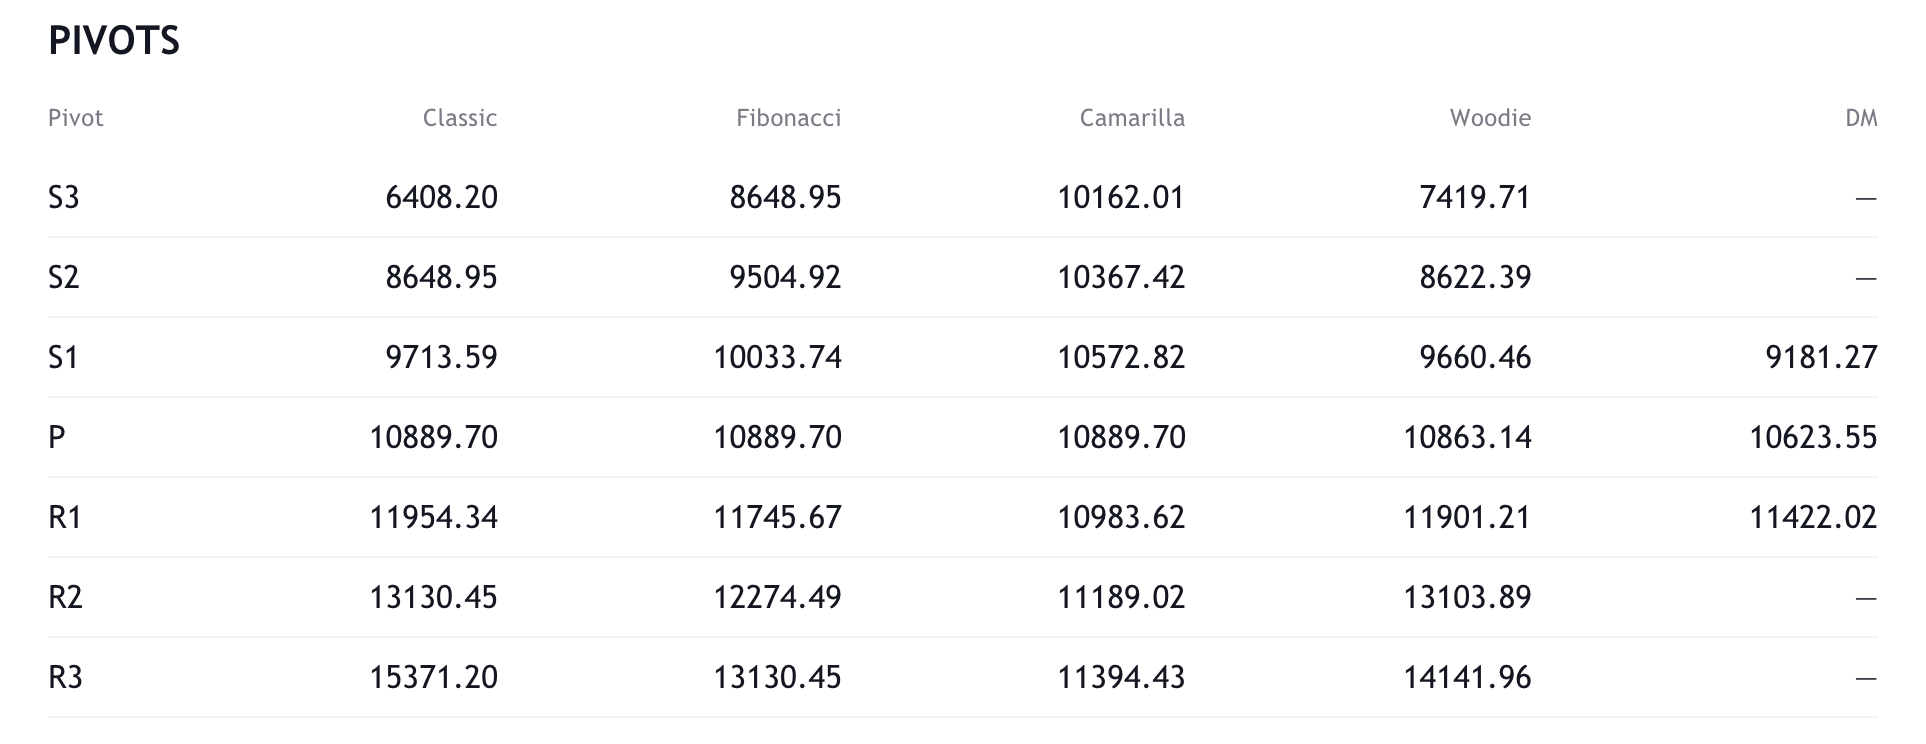
Resistance and support
What they said yesterday…
Satoshi started a fire in cyberspace. While the fearful run from it and fools dance around it, the faithful feed the flame, and dream of a world bathed in the warm glow of cyberlight. #Bitcoin
— Michael Saylor (@michael_saylor) October 25, 2020
MicroStrategy CEO and mega bull, Michael Saylor gets poetic
The biggest bank in America just called #Bitcoin a competitor to gold.
Let that sink in. pic.twitter.com/Ge6Ikeqjq5
— Cole Garner (@ColeGarnerBTC) October 25, 2020
“First they ignore you, then they laugh at you, then they fight you, then you win”
Exciting to see more mainstream financial services players getting on the crypto bandwagon. Many banks now pursuing #BTC and stablecoins support after this week’s announcement by @PayPal. We’re turning a corner.
— David Marcus (@davidmarcus) October 25, 2020
Libra supremo, David Marcus on the big boys coming in
Bitcoin just had its highest weekly close since January 2018. wow pic.twitter.com/U38odjXcjM
— Joseph Young (@iamjosephyoung) October 26, 2020
What does this week hold?
What other data points would you like to see covered in our Daily Report? Let us know on Twitter.
Did you find this useful?