Discover
 Help Centre
 Status
 Company
 Careers
 Press
PressDaily market update: Bitcoin market drops further into Fear zone

It’s Wednesday! How’s everyone feeling today?

Here’s your daily dose of market movements, use them or lose them. If you’re new to the world of crypto trading, don’t forget to take a look through our beginner’s guide to crypto trading series, starring in-depth explorations of common strategies, market analysis techniques, and more. It will help you use the data in this update to make your crypto trading decisions.
The content of this article is for information purposes only and is not investment advice or any form of recommendation or invitation. Luno always advises you to obtain your own independent financial advice before investing or trading in cryptocurrency.
All information is correct as of 7.00am BST
Bitcoin price
We closed yesterday, 8 September, 2020, at a price of $10,131.52 – with a daily high of $10,414.78 and a low of $9,945.11.
That’s down from a closing price of $10,369.56 the day before. On the same day last year, it was $10,441.28.
We’re 49.57% below bitcoin‘s all-time high of $20,089 (17 December 2017).
Bitcoin volume
The volume traded yesterday was $33,430,927,462 – down from $33,703,098,409 the day before.
Market capitalisation
Bitcoin’s market capitalisation as of yesterday was $187,267,336,728, down from $191,657,203,885 the day before. To put that into context,
Fear and Greed Index
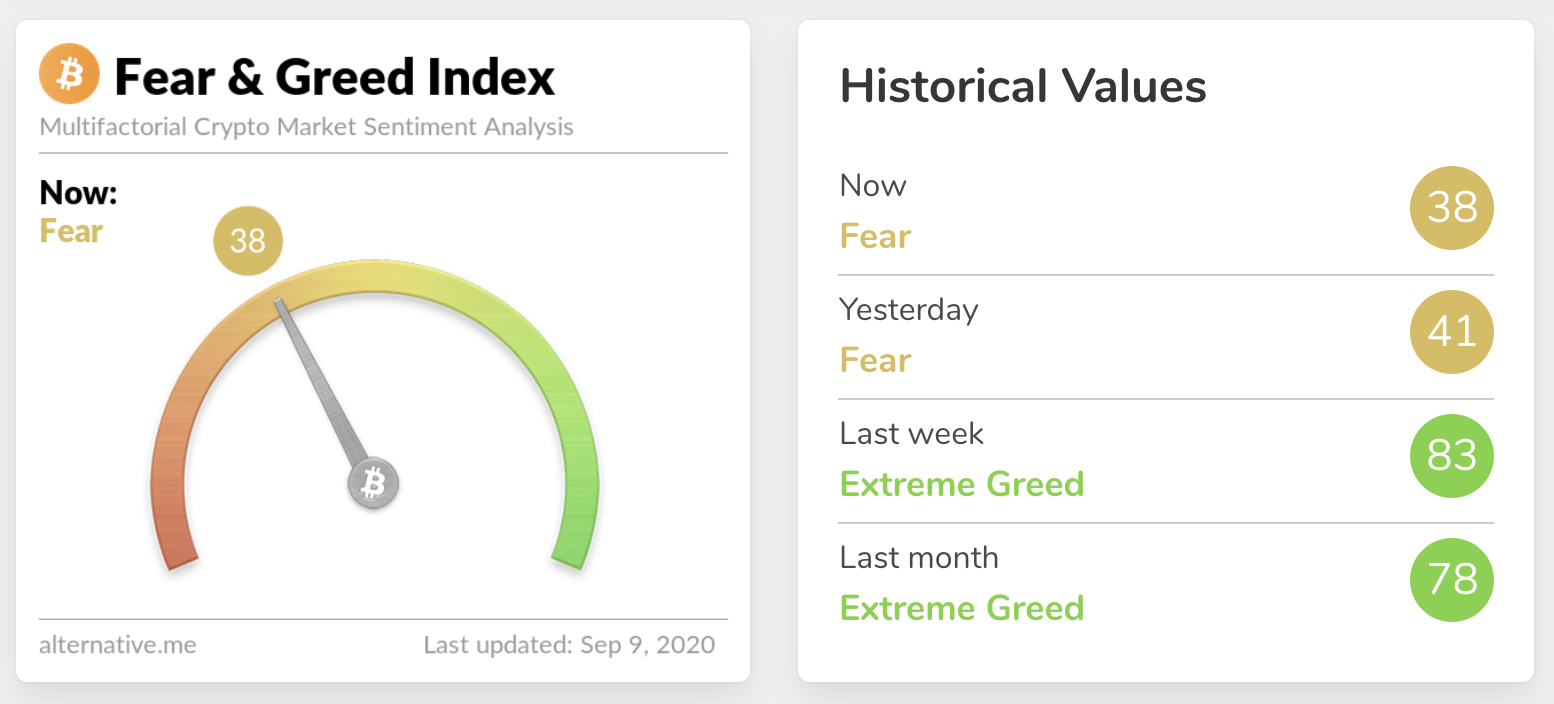
We saw another drop in sentiment yesterday, falling further into the Fear zone down to 38.
Extreme fear can be a sign that investors are too worried, which could be a buying opportunity. When Investors are getting too greedy, that means the market may be due for a correction.
Correlation with other assets
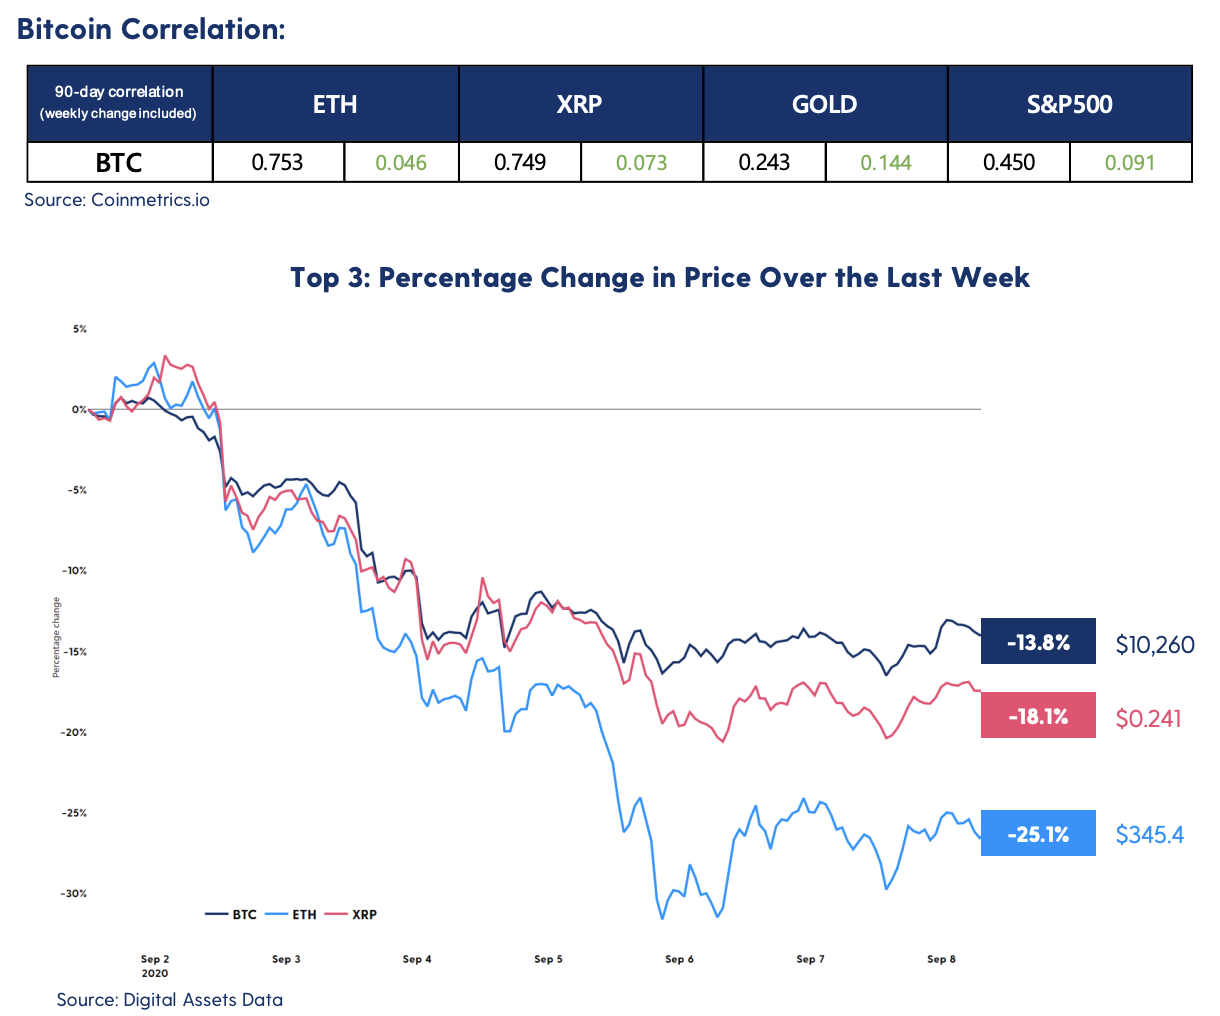
Stock market correlation
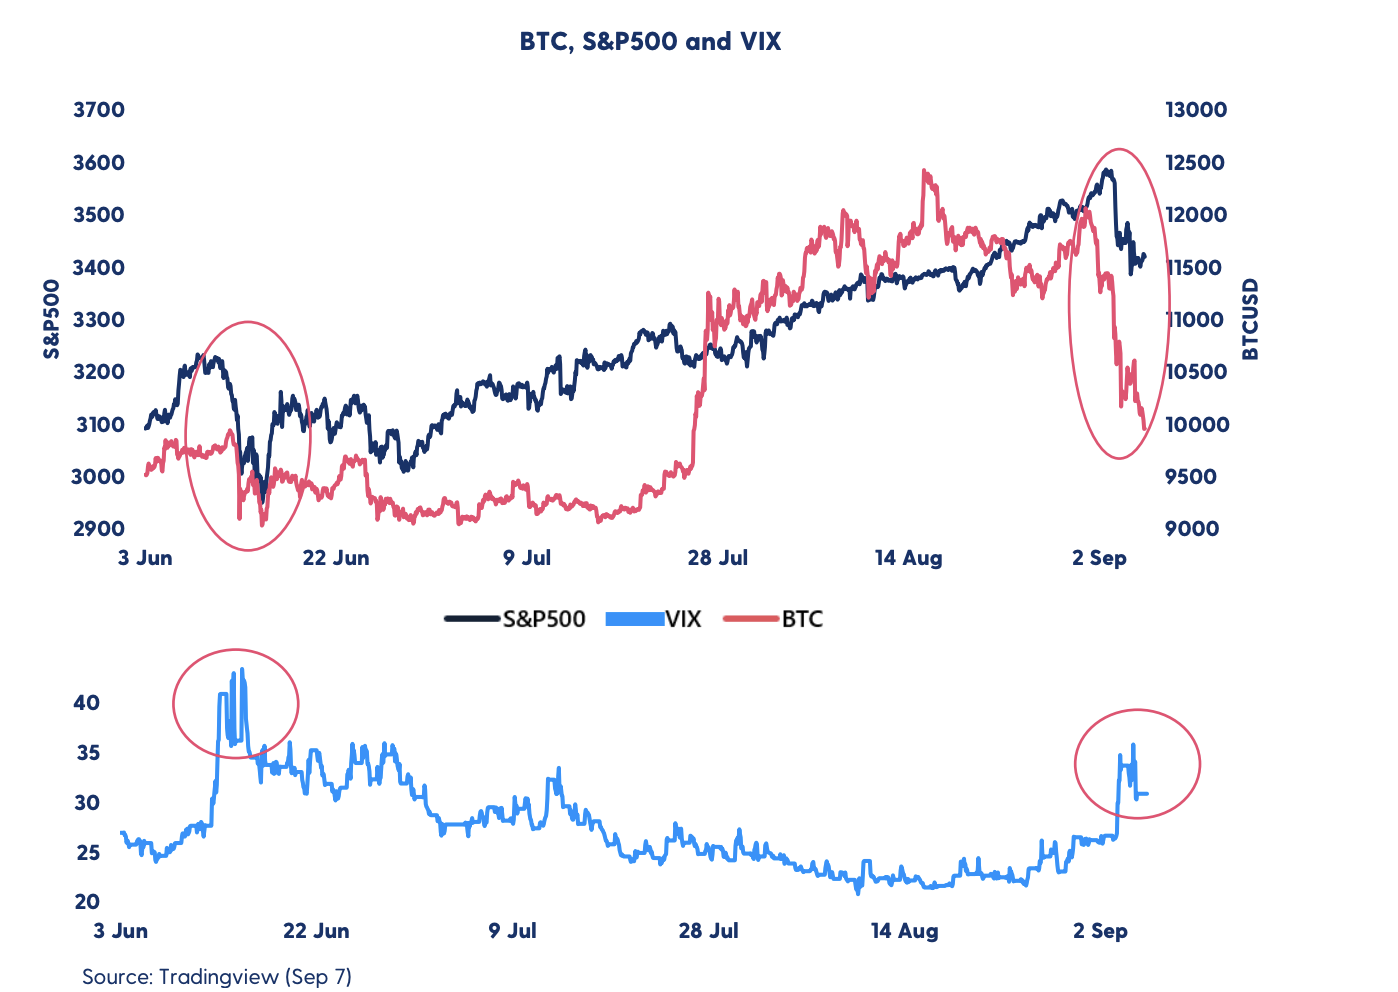
The VIX Index, which measures volatility on the S&P 500 and is often called the fear index, jumped to the highest level in over two months last week.
It’s still too early to tell if this is a minor correction or a trend shift that means the fear is back. Last time we saw a significant spike in VIX, both the S&P 500 and BTC corrected sharply, but it all ended up as a minor correction before continuing to the upside. Will this happen again, or are we in for a larger correction?
Global In/Out of the money
For any address with a balance of tokens, ITB identifies the average price (cost) at which those tokens were purchased and compares it with the current price. If the current price is higher than average cost, address is ‘In the Money’. If the current price is lower than the average cost, the address is ‘Out of the Money’.
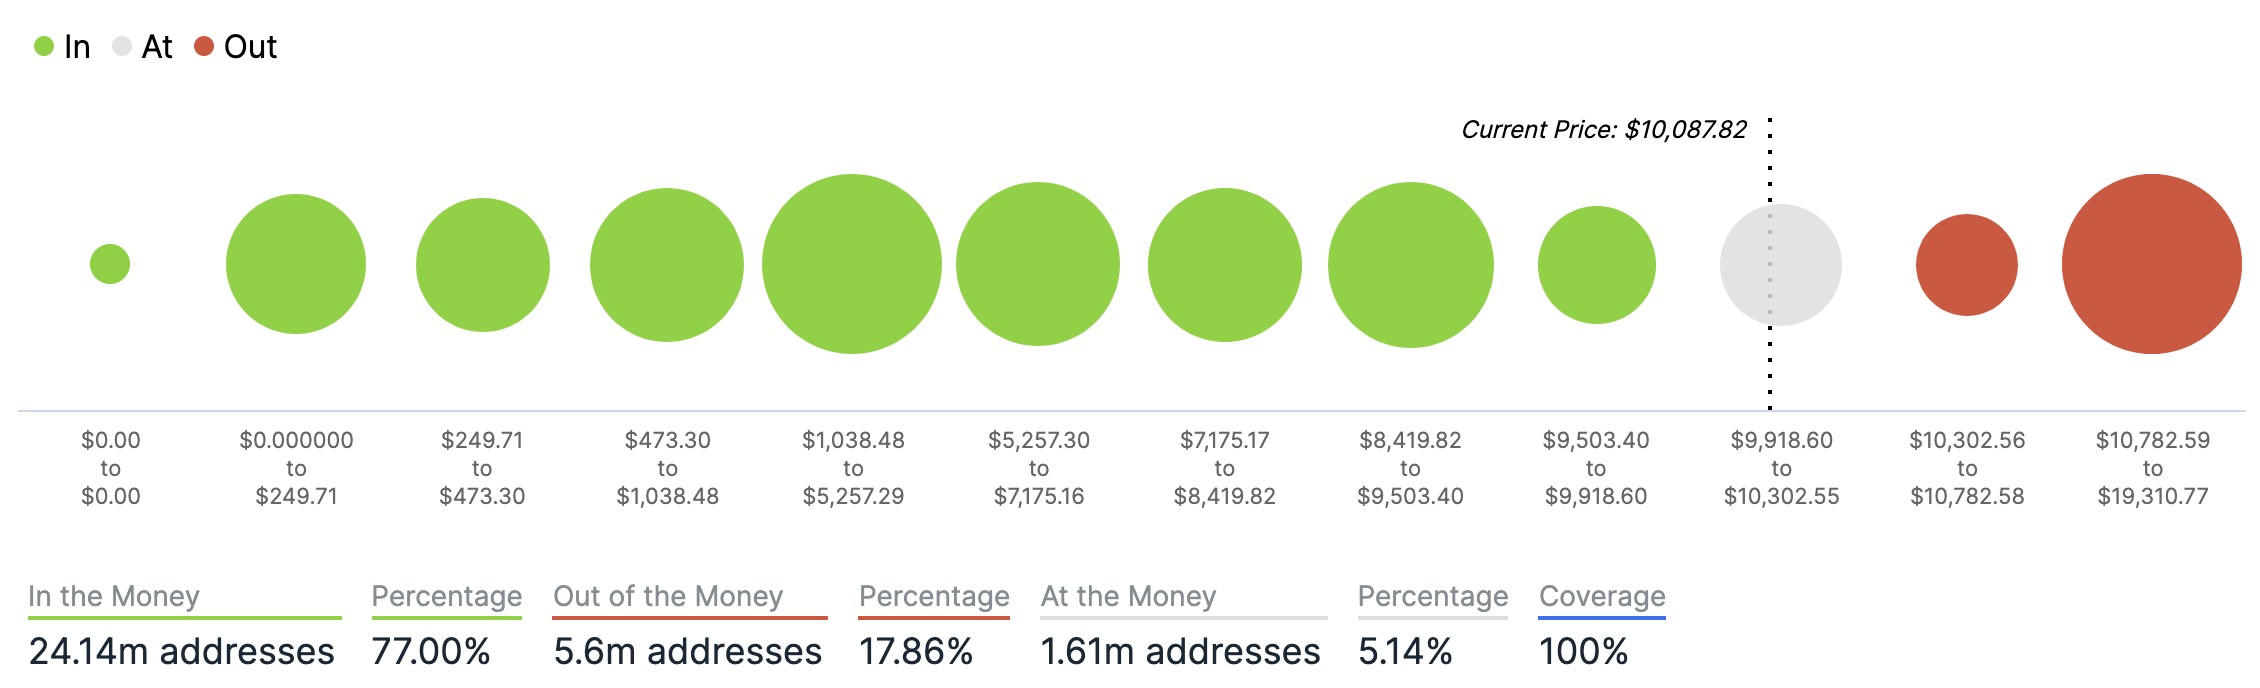
Chart courtesy of IntoTheBlock.com
Volatility
Annualised price volatility using 365 days.
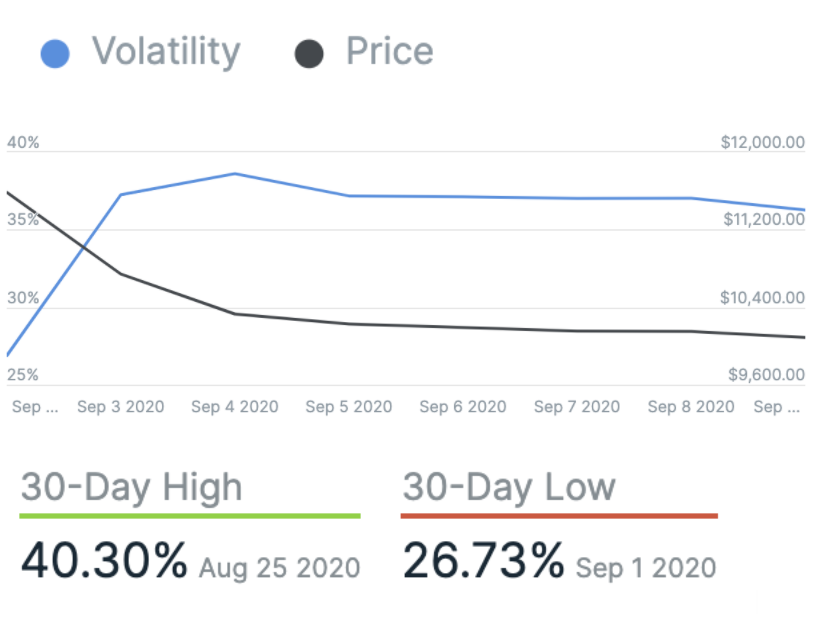
Chart courtesy of IntoTheBlock.com
Bitcoin’s market dominance
Bitcoin’s market dominance stands at 60.62. Its lowest recorded dominance was 37.09 on 8 January, 2018.
Relative Strength Index (RSI)
The daily RSI is currently 36.33. Values of 70 or above indicate that an asset is becoming overbought and may be primed for a trend reversal or experience correction in price – an RSI reading of 30 or below indicates an oversold or undervalued condition.
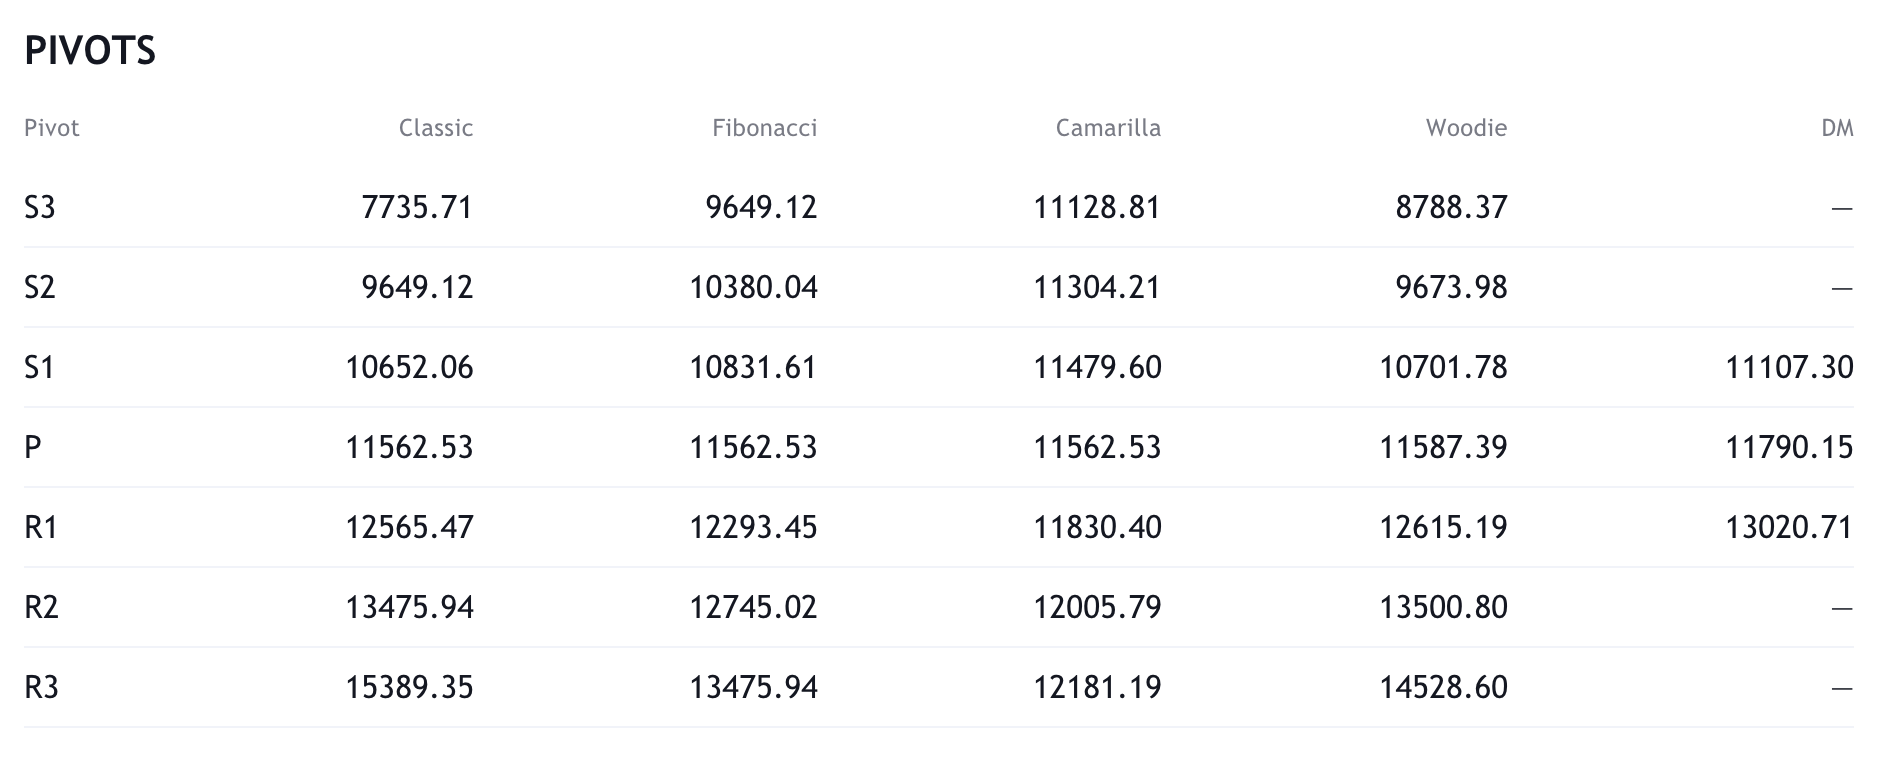
Resistance and support
What they said yesterday…
.@adamcurry talking Tom @joerogan about why he needs #Bitcoin
“You’re gonna need a Bitcoin, at least one” pic.twitter.com/Rnxh3bZpZa
— BrianHarrington.org (@BrainHarrington) September 8, 2020
Gold bug: “How is #bitcoin better than #gold?”
Me: pic.twitter.com/NZivJ8qQJ2— Lucho Poletti (@LuchoPoletti) September 8, 2020
elmer asked me if i own any bitcoin like its 2017 or something
— Looney Tunes (@WBLooneyTunes) September 8, 2020
What other data points would you like to see covered in our Daily Report? Let us know on Twitter.
Did you find this useful?