Discover
 Help Centre
 Status
 Company
 Careers
 Press
PressDaily market update: Bitcoin over $13,000 for first time since June 2019

Yesterday, we asked if bitcoin’s surge over $12,000 could be sustained. It was, as it turns out, a silly question. Of course it could! Bitcoin hit a daily high over $13,000 for the first time since June 2019 and is still trading strong.
There was good news all over for crypto fans, with PayPal also announcing that it’s to start supporting cryptocurrency, opening the doors to mass adoption on a scale never before seen. Will the good news continue today? Now moon?

If you’re new to the world of crypto trading and want to make sense of all these indicators, check out our beginner’s guide to crypto trading series, featuring in-depth explorations of common strategies, market analysis techniques, and more.
All information is correct as of 08:30am BST.
Bitcoin price
We closed yesterday, 21 October, 2020, at a price of $12,823.69, with a daily high of $13,184.57 and a low of $11,900.93. That’s the highest closing price since 26 June 2019 and the first time we’ve been over $13,000 since 27 June.
We’re 36.17% below bitcoin‘s all-time high of $20,089 (17 December 2017).
As of today, buying bitcoin has been profitable for…
98.2% of all days since 2013-04-28.
Bitcoin volume
The volume traded yesterday was $43,414,712,626 – up from $30,915,821,592 the day before. That’s the highest daily trading volume since 11 September. High volume indicates that a significant price movement has stronger support and is more likely to be sustained.
Market capitalisation
Bitcoin’s market capitalisation as of yesterday was $237,532,386,963, up from $220,721,282,865 the day before. That’s the highest it’s been since 13 January 2018.
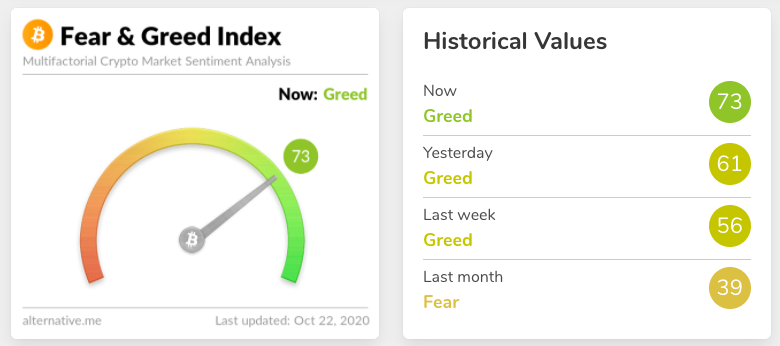
Fear and Greed Index
Greed is back! The uncertainty we saw in September is now truly in the rear view mirror, with the sentiment Index continuing its ascent from 61 yesterday to 73 today. Extreme fear can be a sign that investors are too worried, which could be a buying opportunity. When Investors are getting too greedy, the market may be due for a correction.
Global In/Out of the money
For any address with a balance of tokens, ITB identifies the average price (cost) at which those tokens were purchased and compares it with the current price. If the current price is higher than average cost, address is ‘In the Money’. If the current price is lower than the average cost, the address is ‘Out of the Money’.
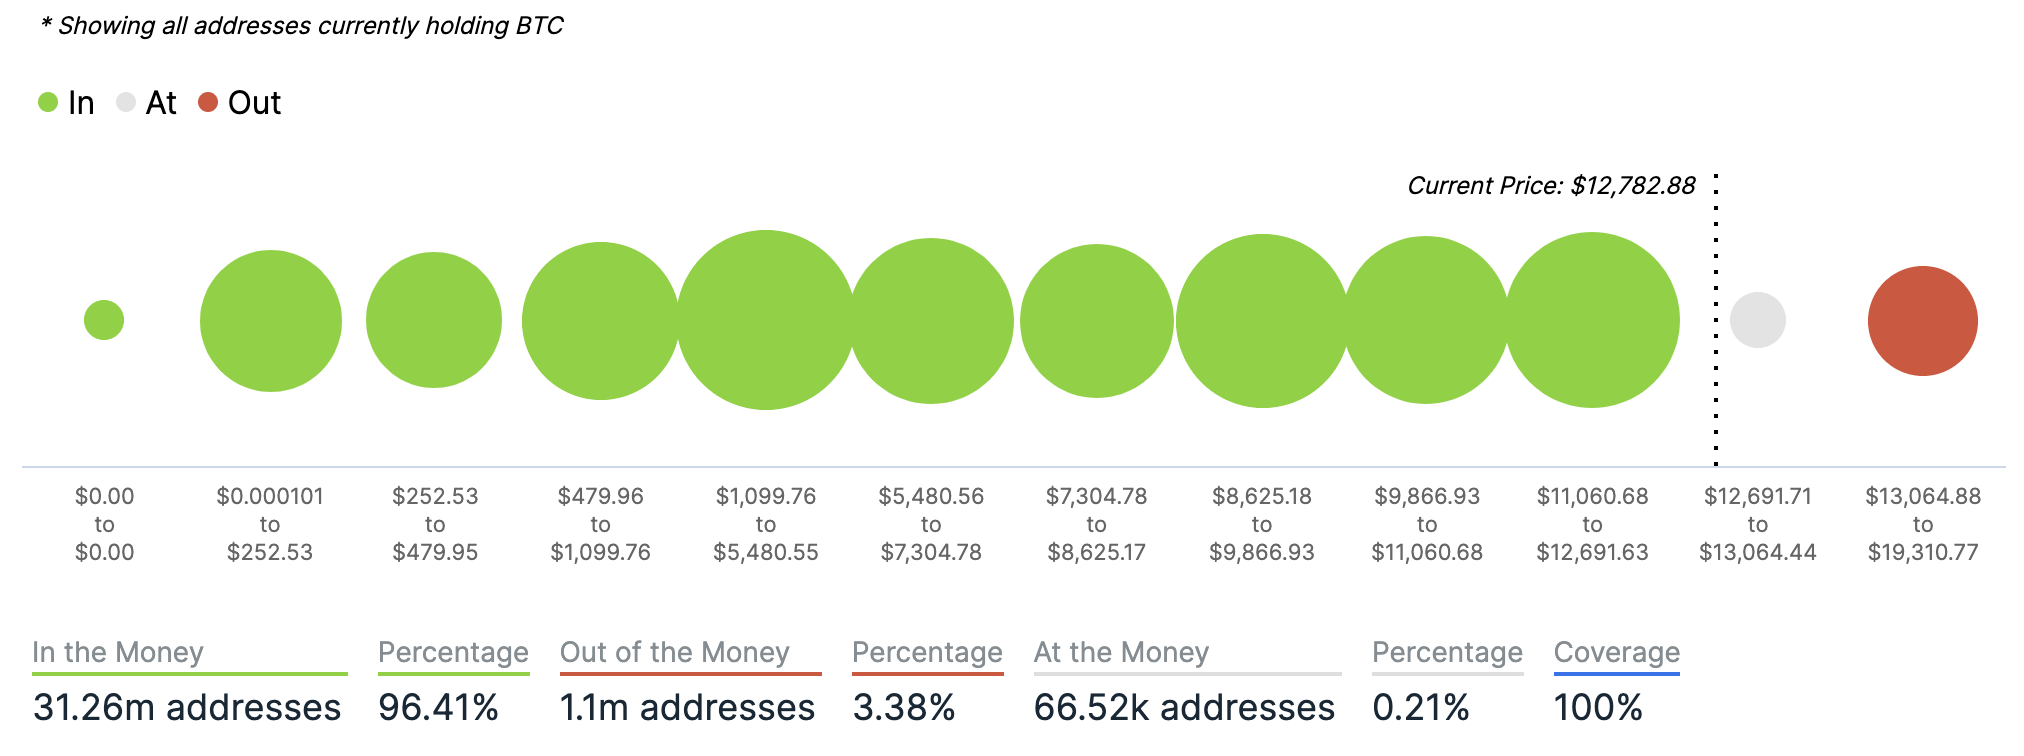
Chart provided by IntoTheBlock.com
Volatility
Annualised price volatility using 365 days.
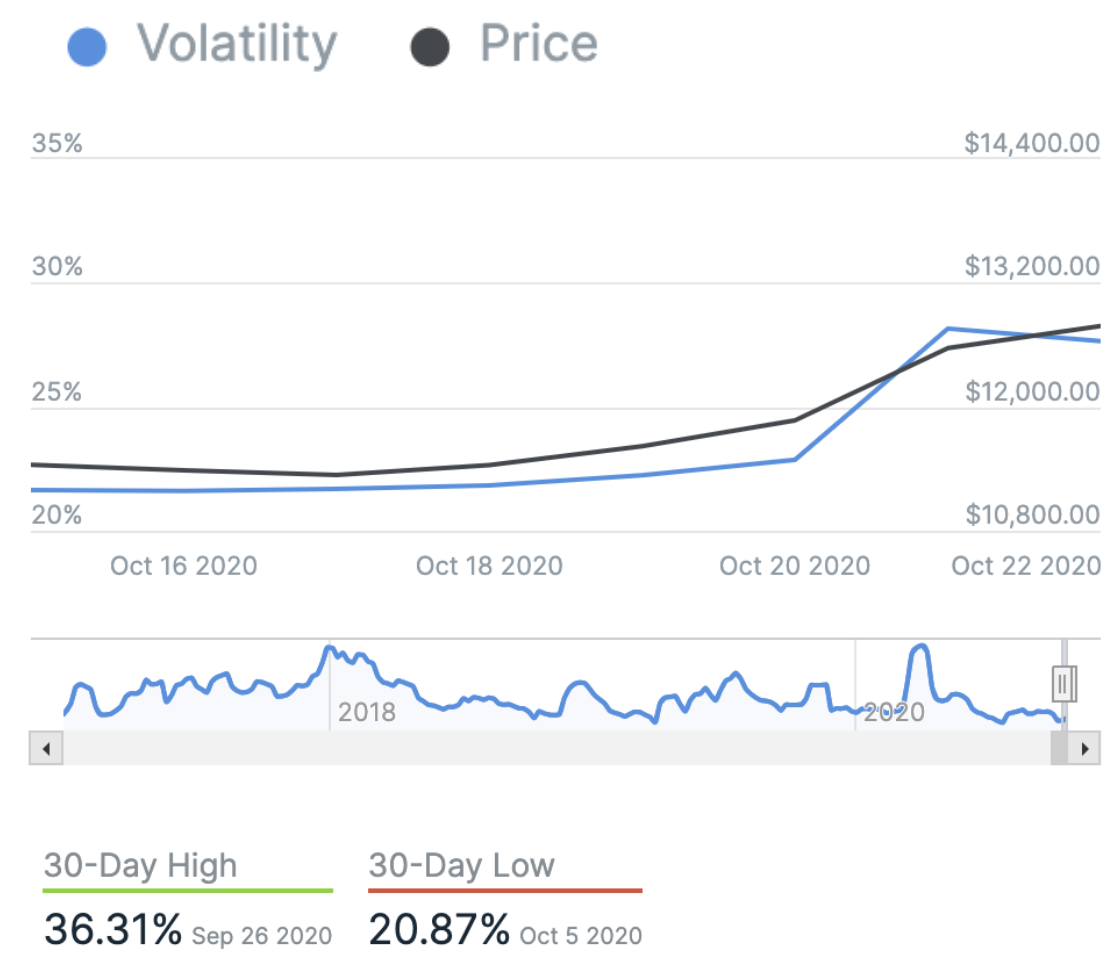
Chart provided by IntoTheBlock.com
Bitcoin’s market dominance
Bitcoin’s market dominance stands at 62.07. Its lowest recorded dominance was 37.09 on 8 January, 2018.
Relative Strength Index (RSI)
The daily RSI is currently 79.17. Values of 70 or above indicate that an asset is becoming overbought and may be primed for a trend reversal or experience correction in price – an RSI reading of 30 or below indicates an oversold or undervalued condition.
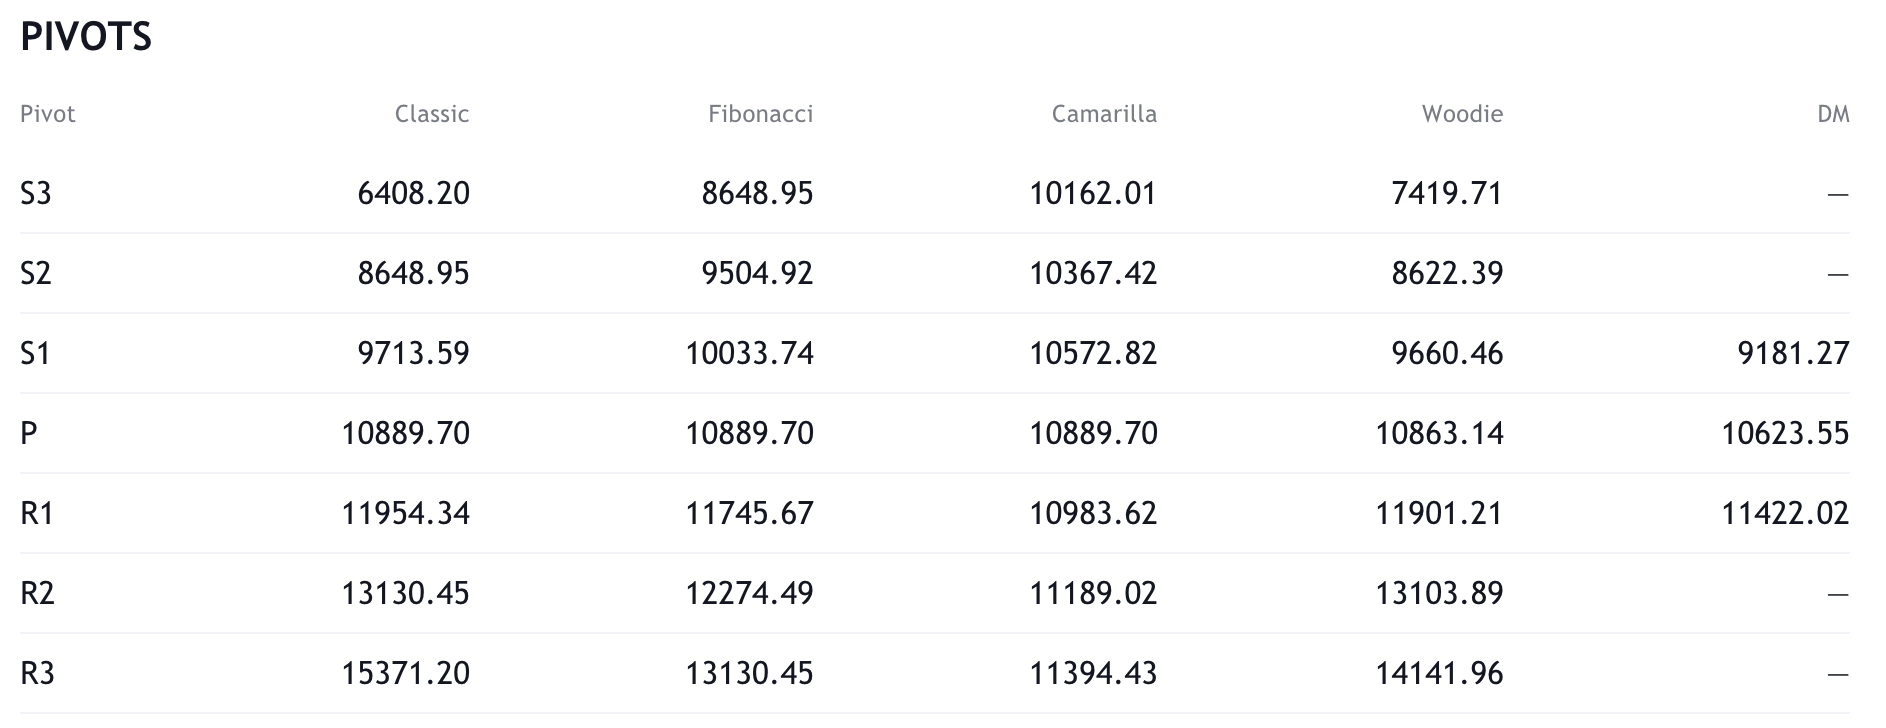
Resistance and support
What they said yesterday…
Countries where #Bitcoin has hit a new ATH in their local currency:
Brazil – pop. 209million
Turkey – pop. 82m
Argentina – pop. 44.5m
Sudan – pop. 41m
Angola – pop. 30m
Venezuala – pop. 29m
Zambia – pop. 17mSoon:
Russia
Colombia… then all other fiat currencies
— Alistair Milne (@alistairmilne) October 22, 2020
Bitcoin has only traded above the current price on 46 days.
Ever.
— The Wolf Of All Streets (@scottmelker) October 21, 2020
$Bitcoin getting ready to knock of the moon’s door
— Tyler Winklevoss (@tylerwinklevoss) October 21, 2020
FYI @michael_saylor up a cool $65mm on his #Bitcoin
— Travis Kling (@Travis_Kling) October 21, 2020
Bitcoin scales so well as a store of value that we can fit a million dollars into a single bitcoin before we need to update the protocol to add more precision.
— Jameson Lopp (@lopp) October 22, 2020
What other data points would you like to see covered in our Daily Report? Let us know on Twitter.
Did you find this useful?