Discover
 Help Centre
 Status
 Company
 Careers
 Press
PressDaily market update: Bitcoin positioning for breakout?

It feels like we’ve been trading in the same zone for months now, but with low volatility, are we set for a major movement in the crypto markets?

If you’re new to the world of crypto trading and want to know how to best use these indicators to trade, don’t forget to take a look through our beginner’s guide to crypto trading series, featuring in-depth explorations of common strategies, market analysis techniques, and more.
The content of this article is for information purposes only and is not investment advice or any form of recommendation or invitation. Luno always advises you to obtain your own independent financial advice before investing or trading in cryptocurrency.
All information is correct as of 10:00am BST.
Bitcoin price
We closed yesterday, 7 October, 2020, at a price of $10,679.14, with a daily high of $10,687.27 and a low of $10,591.96.
On 7 October, 2019, the closing price was $8,245.62. On 7 October, 2018, it was $6,602.95 and the same date in 2017 was $4,426.89
We’re 46.84% below bitcoin‘s all-time high of $20,089 (17 December 2017).
Bitcoin volume
The volume traded yesterday was $17,634,388,529 – down from $22,264,958,686 the day before.
Market capitalisation
Bitcoin’s market capitalisation as of yesterday was $197,678,953,704, up from $196,604,996,202 the day before. To put that into context, Jeff Bezos is currently worth $175.3 billion. This means he can only afford to buy 88.68% of all bitcoin. Bad luck, Jeff.
As of today, buying bitcoin has been profitable for…
93.1% of all days since 2013-04-28.
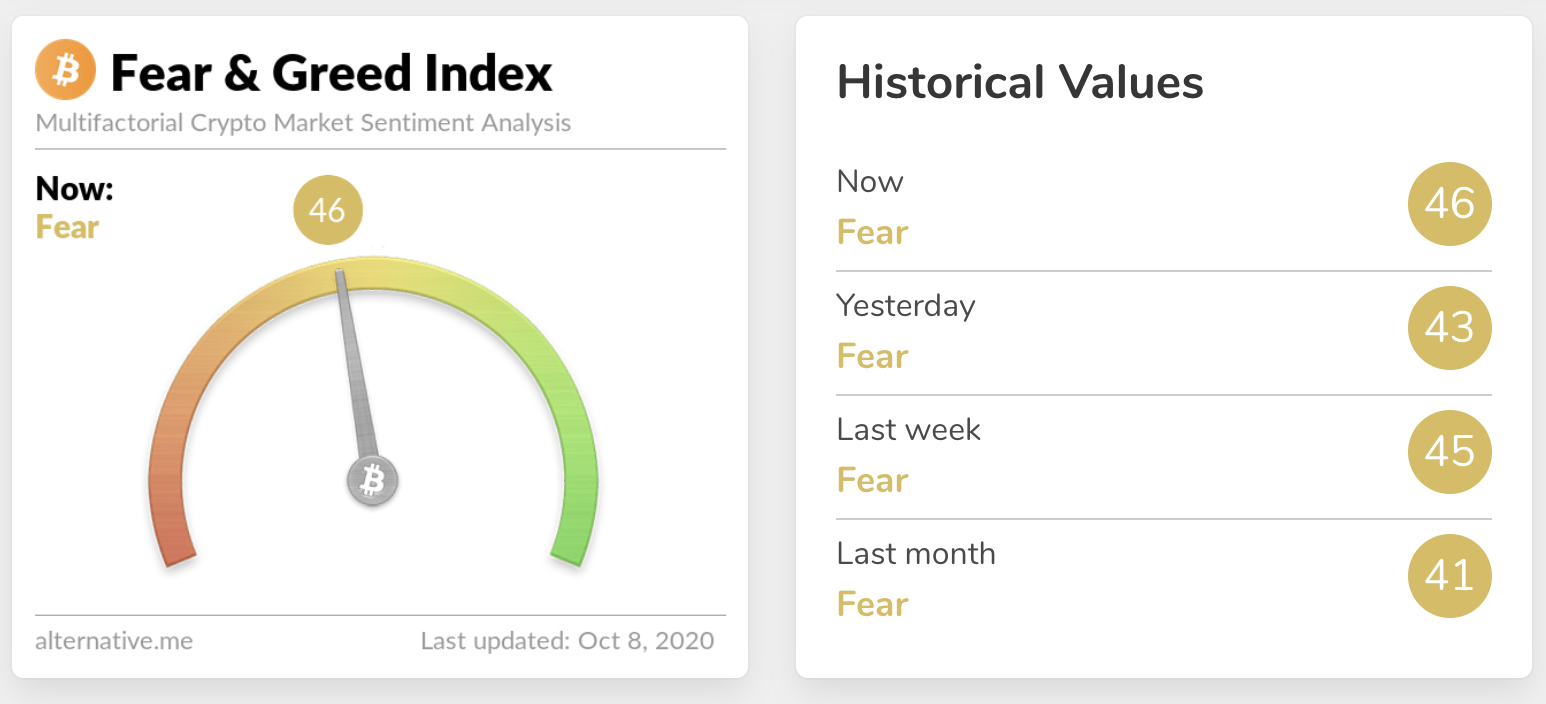
Fear and Greed Index
Sentiment is at 46 – up from 43 yesterday. Extreme fear can be a sign that investors are too worried, which could be a buying opportunity. When Investors are getting too greedy, that means the market may be due for a correction. Are we set for a big move?
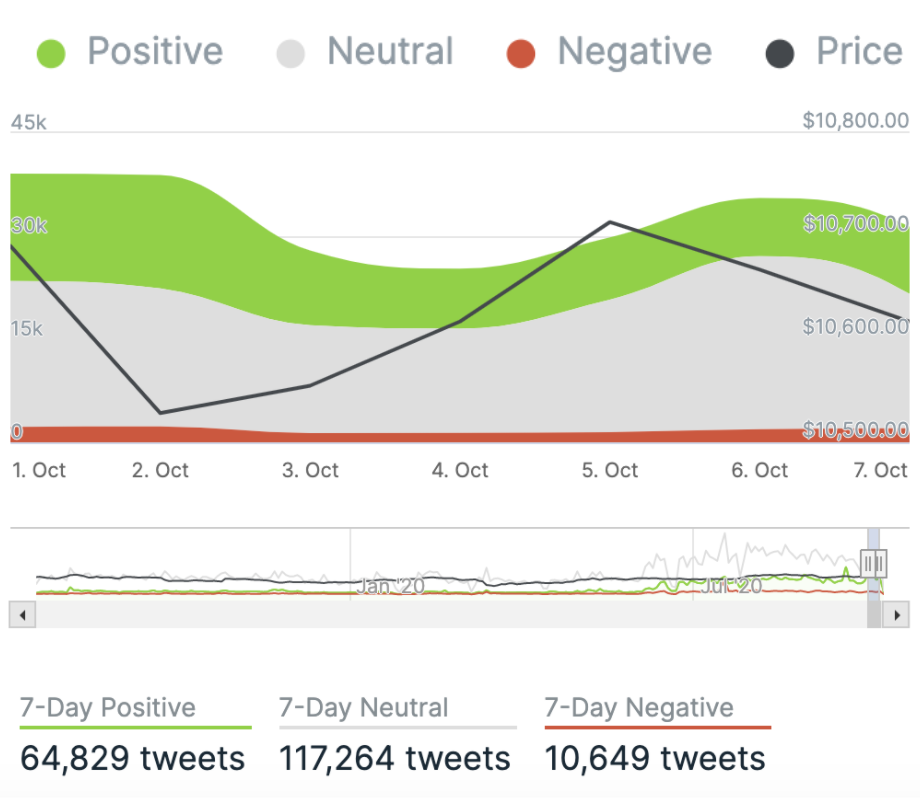
Twitter sentiment
Yesterday, there were 9,831 tweets sent with a positive connotation towards bitcoin, 19,556 with a neutral connotation, and 2,036 were negative.
Global In/Out of the money
For any address with a balance of tokens, ITB identifies the average price (cost) at which those tokens were purchased and compares it with the current price. If the current price is higher than average cost, address is ‘In the Money’. If the current price is lower than the average cost, the address is ‘Out of the Money’.
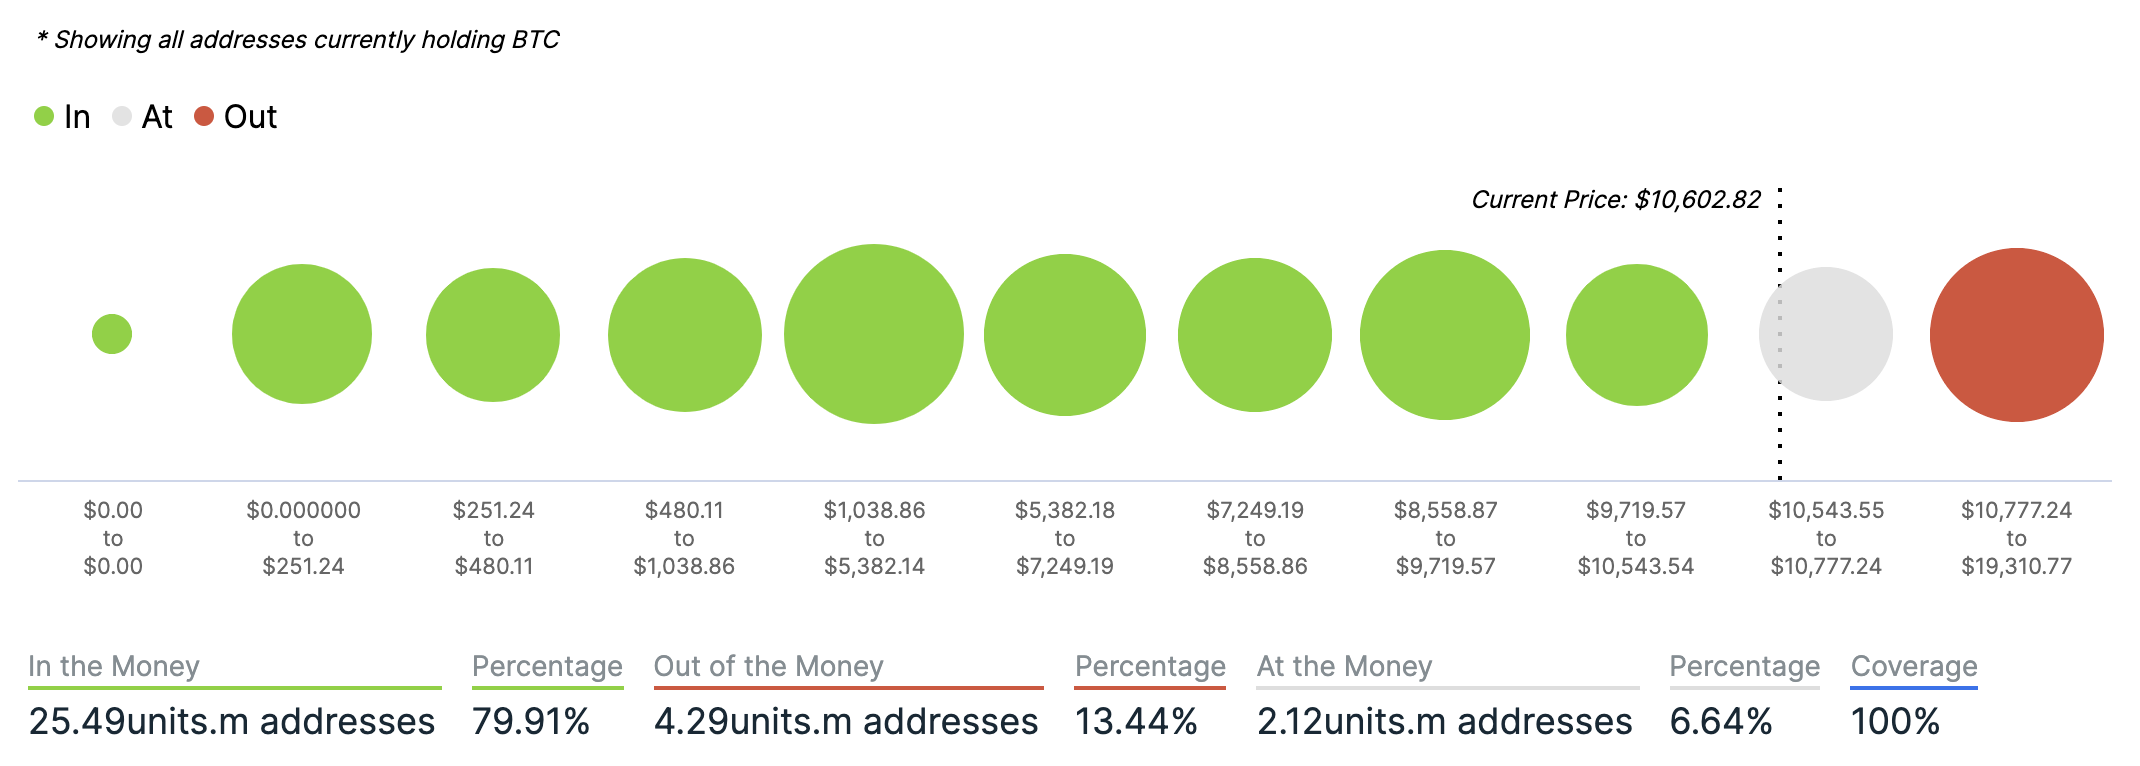
Chart provided by IntoTheBlock.com
Volatility
Annualised price volatility using 365 days.
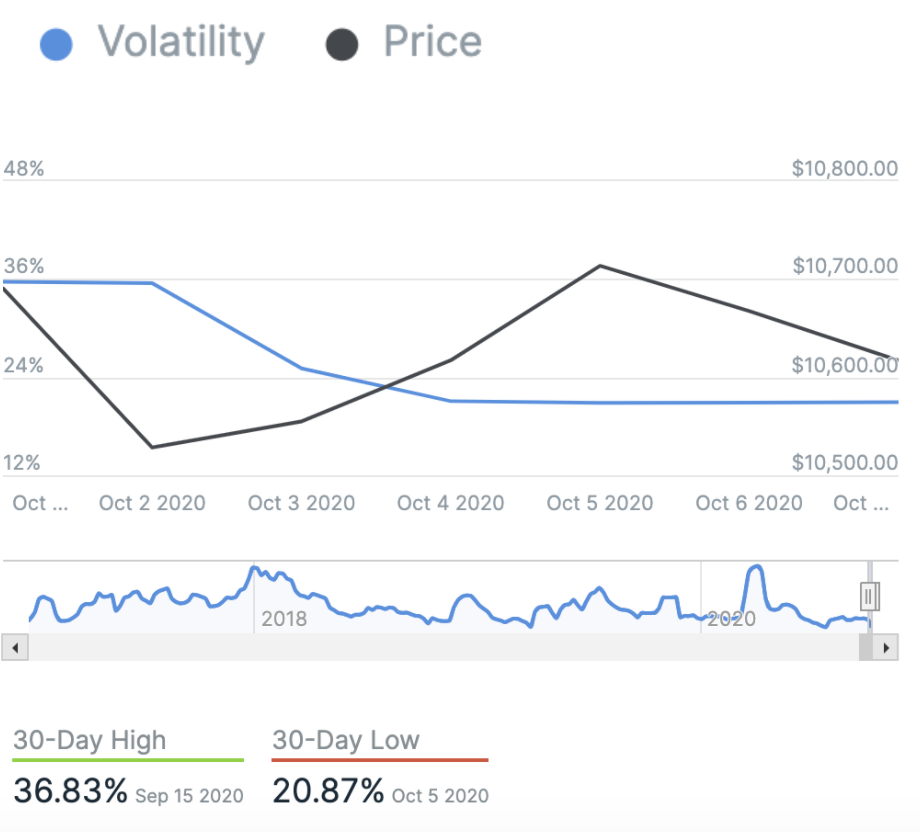
Chart provided by IntoTheBlock.com
Bitcoin’s market dominance
Bitcoin’s market dominance stands at 60.25. Its lowest recorded dominance was 37.09 on 8 January, 2018.
Relative Strength Index (RSI)
The daily RSI is currently 45.59. Values of 70 or above indicate that an asset is becoming overbought and may be primed for a trend reversal or experience correction in price – an RSI reading of 30 or below indicates an oversold or undervalued condition.
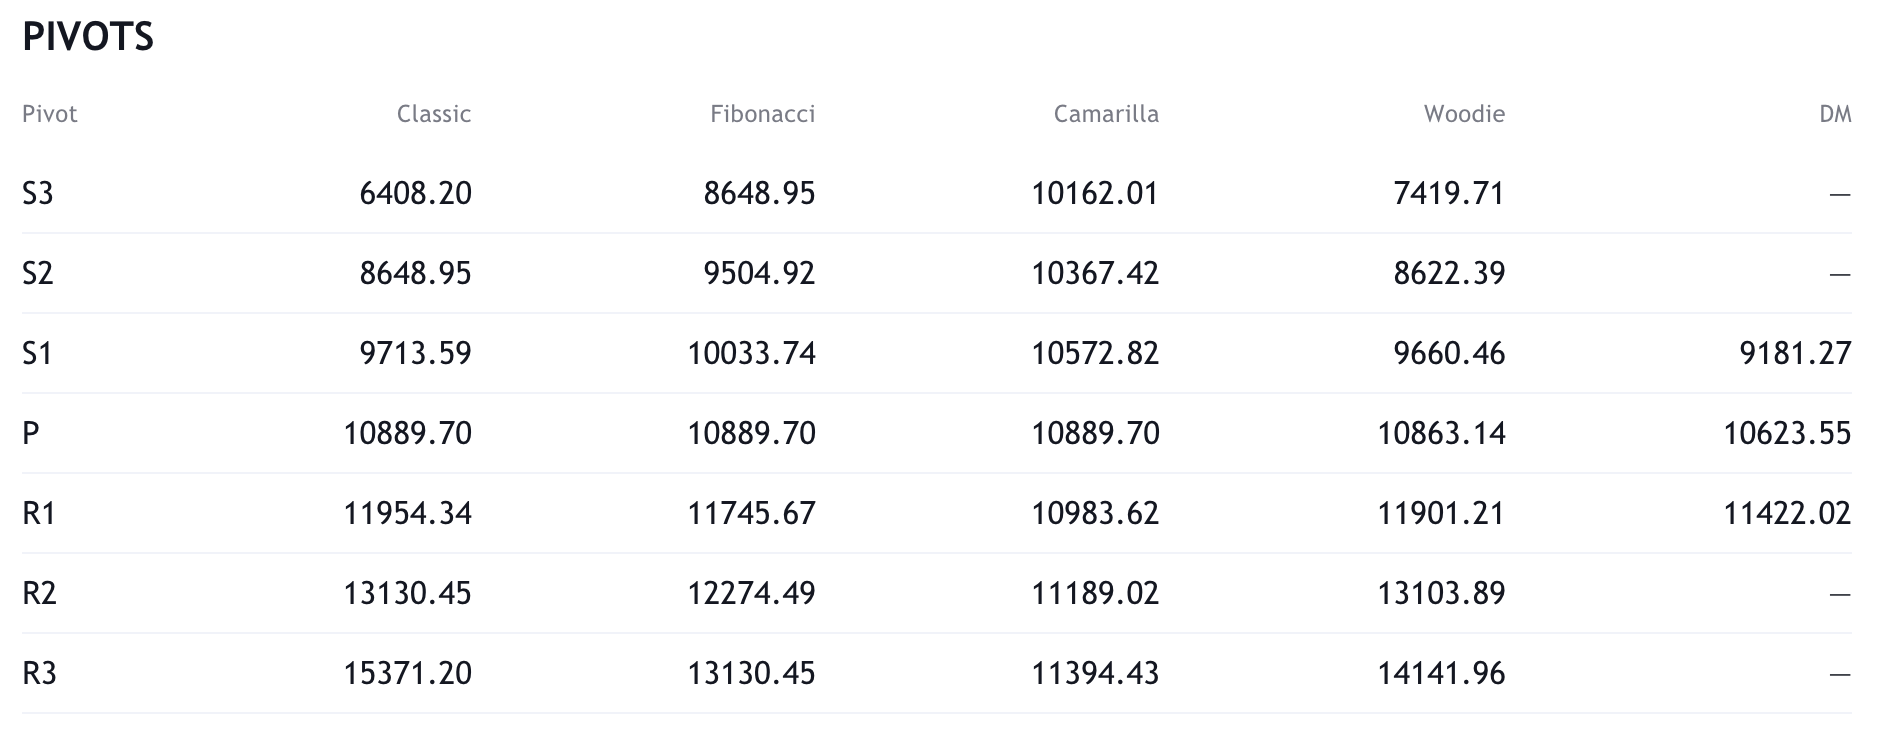
Resistance and support
What they said yesterday…
Anyone can generate a bitcoin private key.
No one can generate your bitcoin private key. pic.twitter.com/m3EoP8VfwP— Jameson Lopp (@lopp) October 7, 2020
Bitcoin 30 day historic volatility has been falling fast and is in the 20’s. In the past it has hit 20% vol 7 times. 6 times prices exploded higher immediately and vol hit 80% in a few months. 1 time (Nov 2018) prices fell sharply. Either way, a big move is coming soon. #Bitcoin pic.twitter.com/9qKdLcAf0V
— Raoul Pal (@RaoulGMI) October 7, 2020
Bitcoin is going to change a lot of lives in 2021 ?
— Crypto Capital Venture ⚡️ (@cryptorecruitr) October 7, 2020
What other data points would you like to see covered in our Daily Report? Let us know on Twitter.
Did you find this useful?