Discover
 Help Centre
 Status
 Company
 Careers
 Press
PressDaily market update: Bitcoin prices sees pullback to $18,000, where to next?


The last few weeks have seen bitcoin go on an incredible run, but it seems that momentum may finally be slowing. Last night saw a long-expected pullback that has seen the price drop to $18,000 at time of writing. This is not necessarily bearish, but could rather be a healthy pullback before continuation to the upside. It seems the crypto market is still trying to make up its mind on how we’re going to end the turbulent year. Where to next?
Here’s today’s market report. If you’re new to the world of crypto, take a look through our beginner’s guide to crypto trading series to get a better idea of all these indicators, starring in-depth explorations of common strategies, market analysis techniques, and more.
The content of this article is for information purposes only and is not investment advice or any form of recommendation or invitation. Luno always advises you to obtain your own independent financial advice before investing or trading in cryptocurrency.
All information is correct as of 09.00am GMT.
Bitcoin price
We closed yesterday, 8 December, 2020, at a price of $18,321.14 – down from $19,191.63 the day before. That’s the lowest closing price since 29 November.
The daily high yesterday was $19,283.48. The daily low was $18,269.95. This time last year, the price of bitcoin closed the day at $7,564.35 and in 2018 it was $3,476.11.
We’re 8.81% below bitcoin‘s all-time high on CoinMarketCap of $20,089 (17 December 2017).
As of today, buying bitcoin has been profitable for…
99.2% of all days since 2013-04-28.
Bitcoin volume
The volume traded yesterday was $31,692,288,756, up from $26,896,357,742 the day before. High volumes can indicate that a significant price movement has stronger support and is more likely to be sustained.
Market capitalisation
Bitcoin’s market capitalisation as of yesterday was $340,148,764,252, down from $356,293,229,783 the day before.
Fear and Greed Index
After yesterday’s pullback, sentiment has fallen but remains high at 86. We’ve now been in Extreme Greed for over a month. It’s important to remember that the index doesn’t stay this high very often and a correction could be on the cards.
Bitcoin’s market dominance
Bitcoin’s market dominance stands at 64.05. Its lowest recorded dominance was 37.09 on 8 January, 2018.
Relative Strength Index (RSI)
The daily RSI is currently 50.52. Values of 70 or above indicate that an asset is becoming overbought and may be primed for a trend reversal or experience a correction in price – an RSI reading of 30 or below indicates an oversold or undervalued condition.
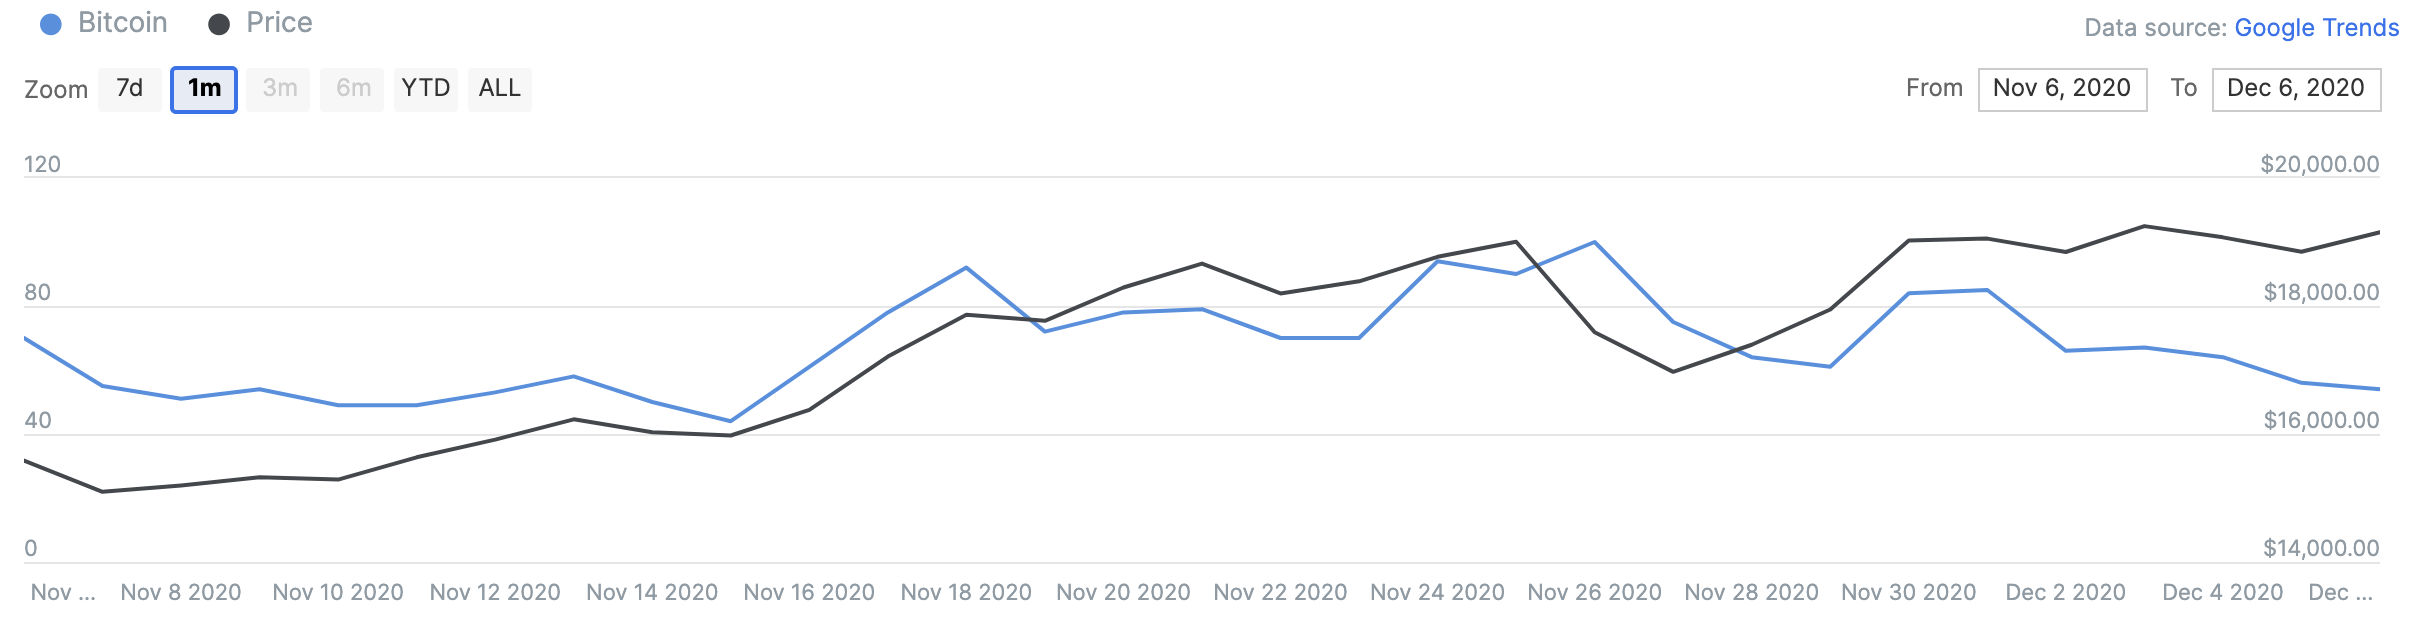
Google trends
The trend in Google searches over the last 90 days. Google shows this chart on a relative basis with a max score of 100 on the day that had the most Google searches for that keyword.
Charts provided by IntoTheBlock.com
In/Out of the money
For any address with a balance of tokens, ITB identifies the average price (cost) at which those tokens were purchased and compares it with the current price. If the current price is higher than average cost, address is ‘In the Money’. If the current price is lower than the average cost, the address is ‘Out of the Money’.
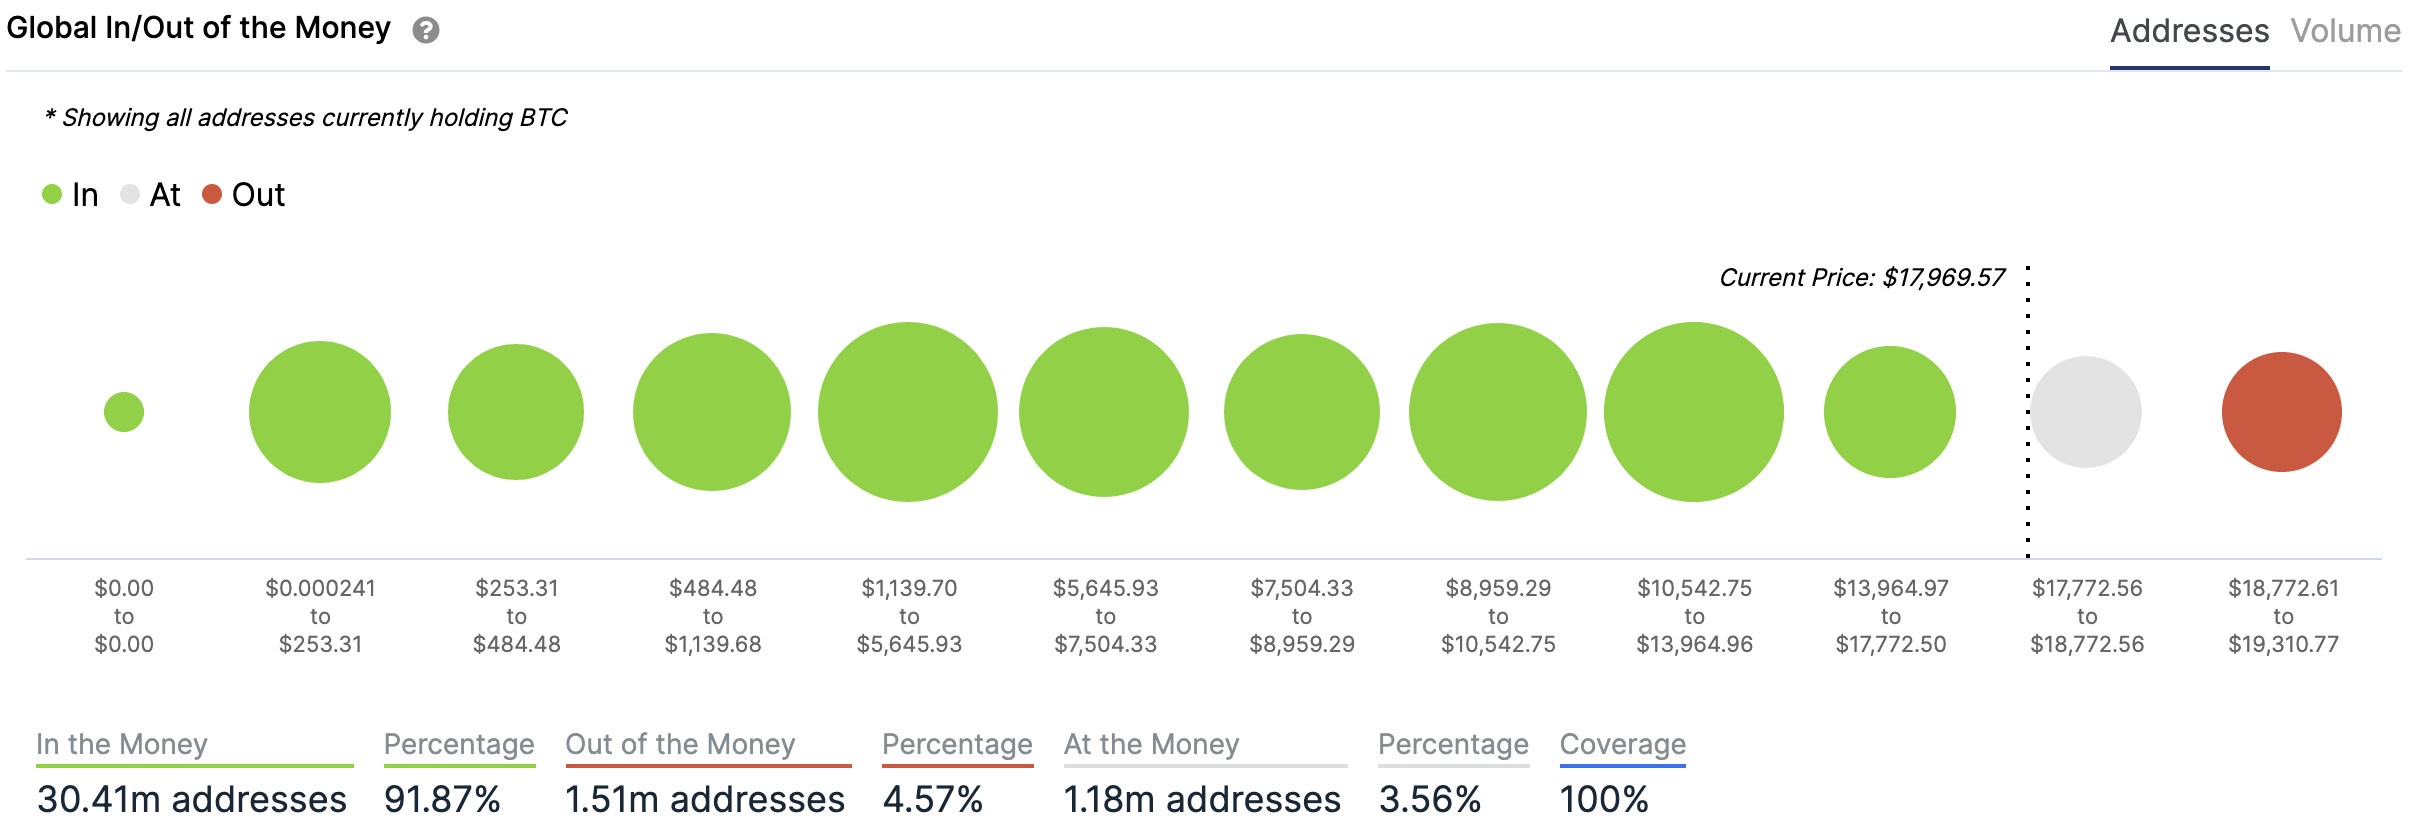
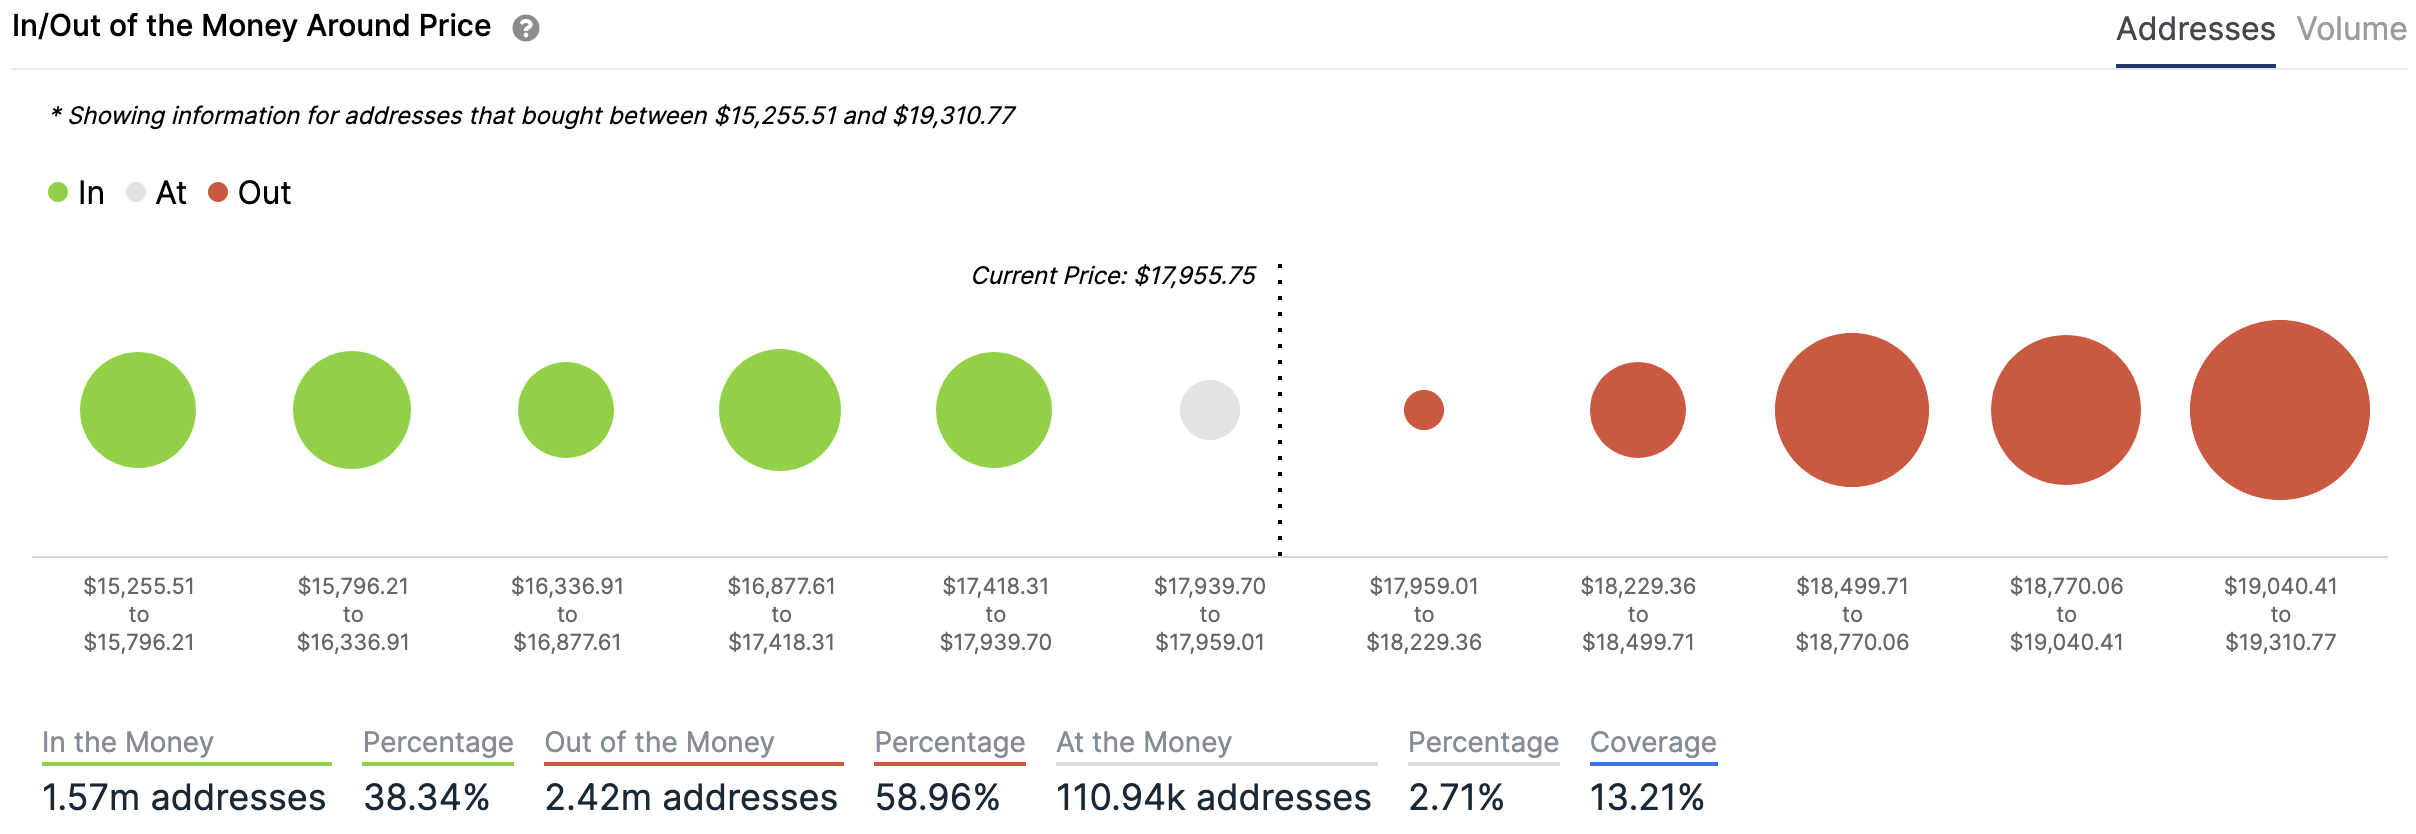
Charts provided by IntoTheBlock.com
Volatility
Annualised price volatility using 365 days.
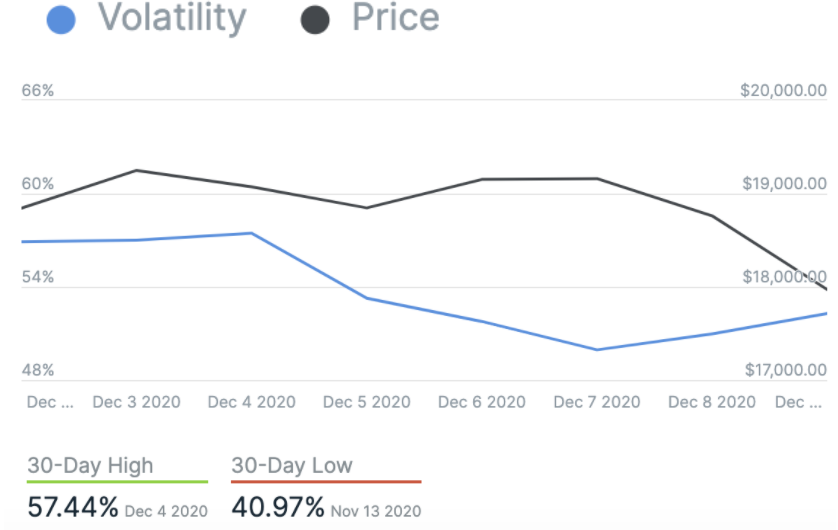
Charts provided by IntoTheBlock.com
Twitter sentiment
Yesterday, there were 10,523 tweets sent with a positive connotation towards bitcoin, 30,337 with a neutral connotation, and 2,676 were negative.
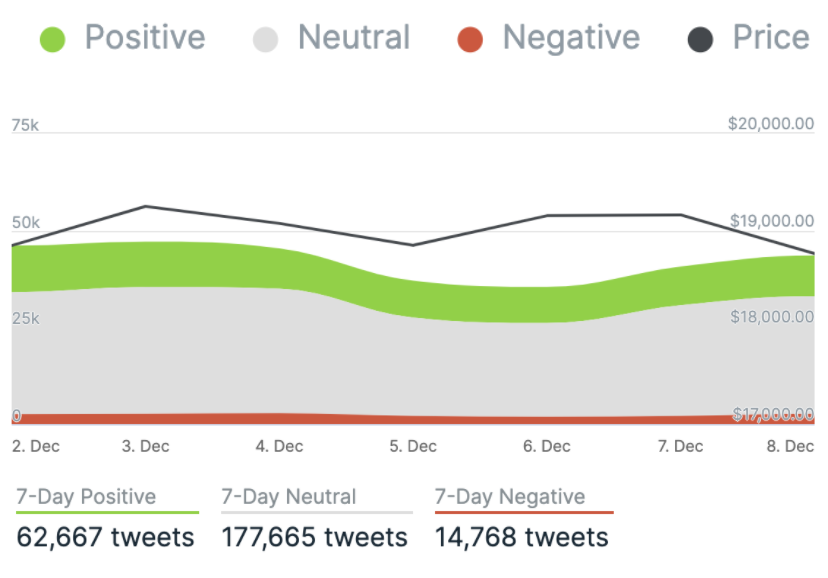
Charts provided by IntoTheBlock.com
What they said yesterday…
“You’re going to see every single financial institution forced into this space.”
Invest 5% of your net worth in #bitcoin says @novogratz.
“We’re at the beginning innings of rebuilding the infrastructure that American & global business will be done on in the future.” pic.twitter.com/b0hdiQwrrG
— Julia Chatterley (@jchatterleyCNN) December 8, 2020
We are also launching a Bitcoin Clean Energy Investment Initiative, committing $10M to support companies that help drive adoption and efficiency of renewables within the bitcoin ecosystem.
More information in our full press release below. (2/2)https://t.co/6ppkwc3Uk2
— Square (@Square) December 8, 2020
[UPDATED] Financial institutions and trading legends that recognize Bitcoin is Gold 2.0:
– Fidelity
– JP Morgan
– Bloomberg
– Deutsche Bank
– Citibank
– Jeffries
– Blackrock
– Susquehanna
– Paul Tutor Jones
– Stanley Druckenmiller
+Guggenheim
+AllianceBernstein
+Bill Miller— Dan Held (@danheld) December 8, 2020
What other data points would you like to see covered in our Daily Report? Let us know on Twitter.
Did you find this useful?