Discover
 Help Centre
 Status
 Company
 Careers
 Press
PressDaily market update: “Fed Chairman Powell will speak about digital currencies next week on IMF panel”

It’s Friday! If you’re here in search of the weekend, you’re out of luck – that’s tomorrow! If you’re looking for the latest market movements though, you’ve come to the right place. It’s still a party too. Of sorts.

If you’re new to the world of crypto trading and want to make sense of all these indicators, take a look at our beginner’s guide to crypto trading series, featuring in-depth explorations of common strategies, market analysis techniques, and more.
The content of this article is for information purposes only and is not investment advice or any form of recommendation or invitation. Luno always advises you to obtain your own independent financial advice before investing or trading in cryptocurrency.
All information is correct as of 07:30am BST.
Bitcoin price
We closed yesterday, 15 October, 2020, at a price of $11,495.35, with a daily high of $11,569.91 and a low of $11,303.60.
On 15 October, 2019, the closing price was $8,205.37. On 15 October, 2018, it was $6,596.54 and the same date in 2017 was $5,678.19.
We’re 42.78% below bitcoin‘s all-time high of $20,089 (17 December 2017).
Bitcoin volume
The volume traded yesterday was $24,487,233,058 – up from $24,103,426,719 the day before. High volume indicates that a significant price movement has stronger support and is more likely to be sustained.
Market capitalisation
Bitcoin’s market capitalisation as of yesterday was $212,873,103,428, up from $211,643,390,713 the day before. To put that into context, Jeff Bezos is currently worth $175.3 billion. This means he can only afford to buy 82.35% of all bitcoin. A bad end of the week for Jeff.
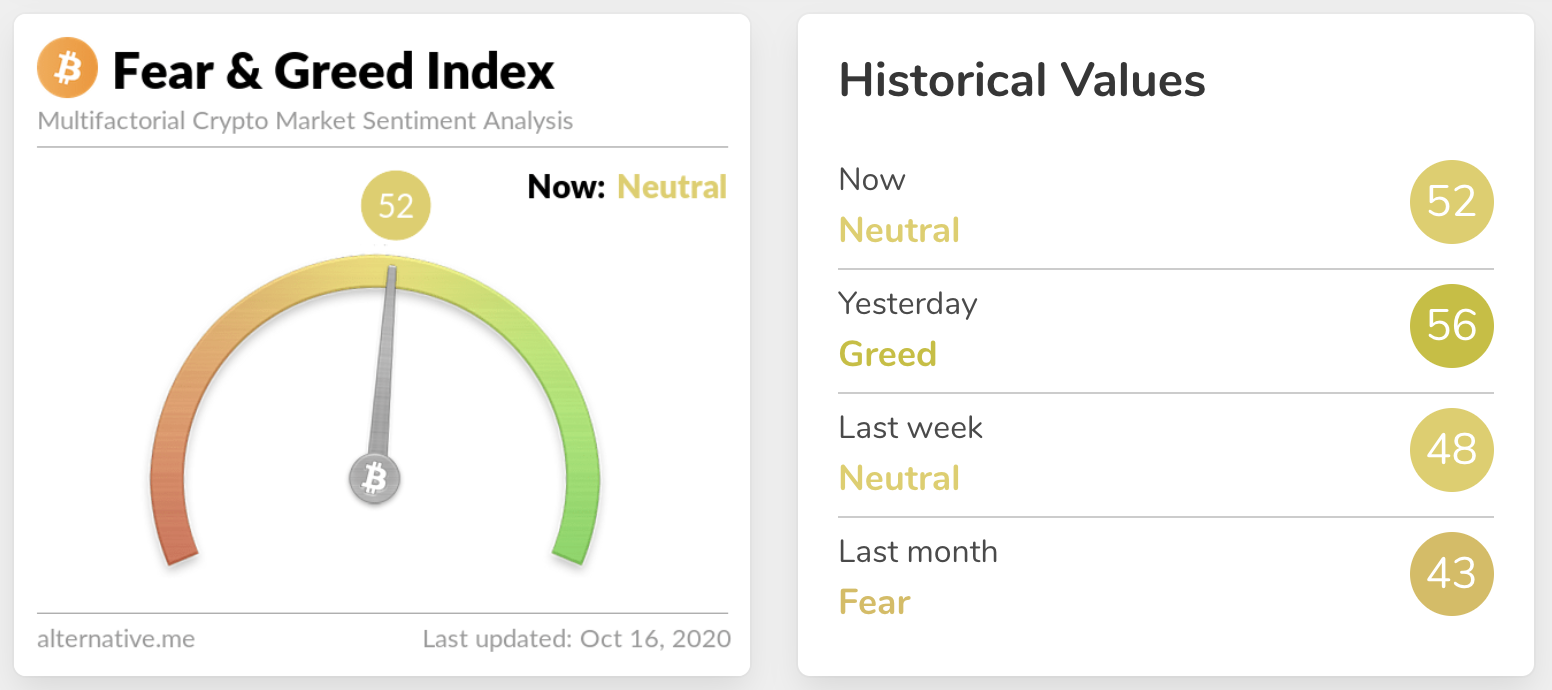
Fear and Greed Index
Sentiment is back down at a neutral 52 after hitting the dizzy heights of 56 yesterday. Extreme fear can be a sign that investors are too worried, which could be a buying opportunity. When Investors are getting too greedy, that means the market may be due for a correction.
Twitter sentiment
Yesterday, there were 9,651 tweets sent with a positive connotation towards bitcoin, 20,241 with a neutral connotation, and 1,719 were negative.
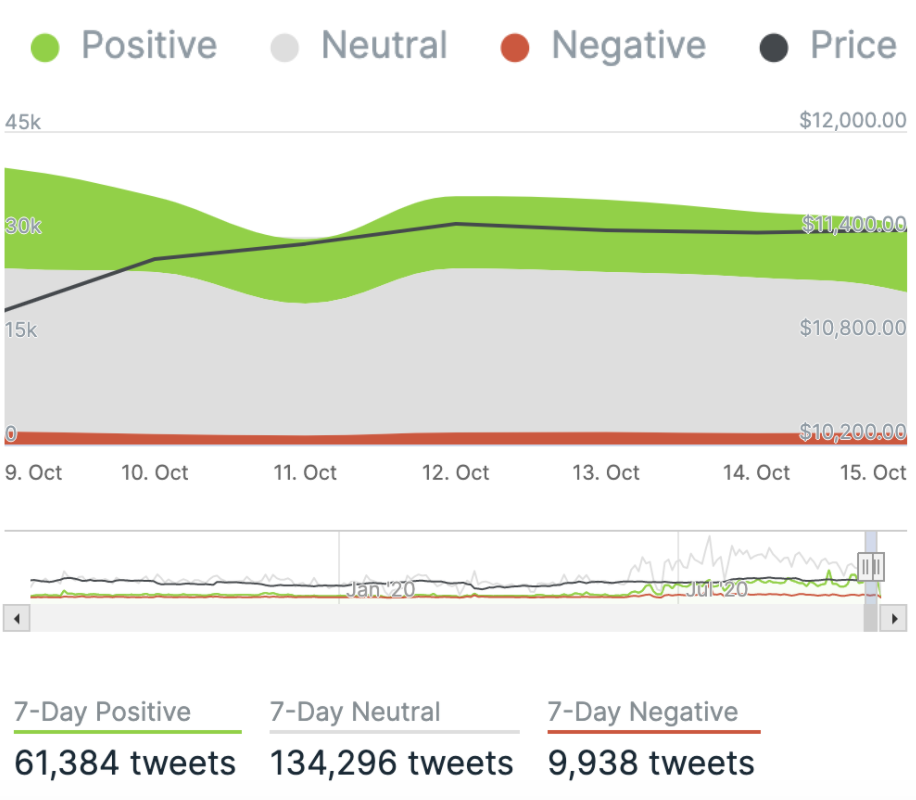
Chart provided by IntoTheBlock.com
Global In/Out of the money
For any address with a balance of tokens, ITB identifies the average price (cost) at which those tokens were purchased and compares it with the current price. If the current price is higher than average cost, address is ‘In the Money’. If the current price is lower than the average cost, the address is ‘Out of the Money’.
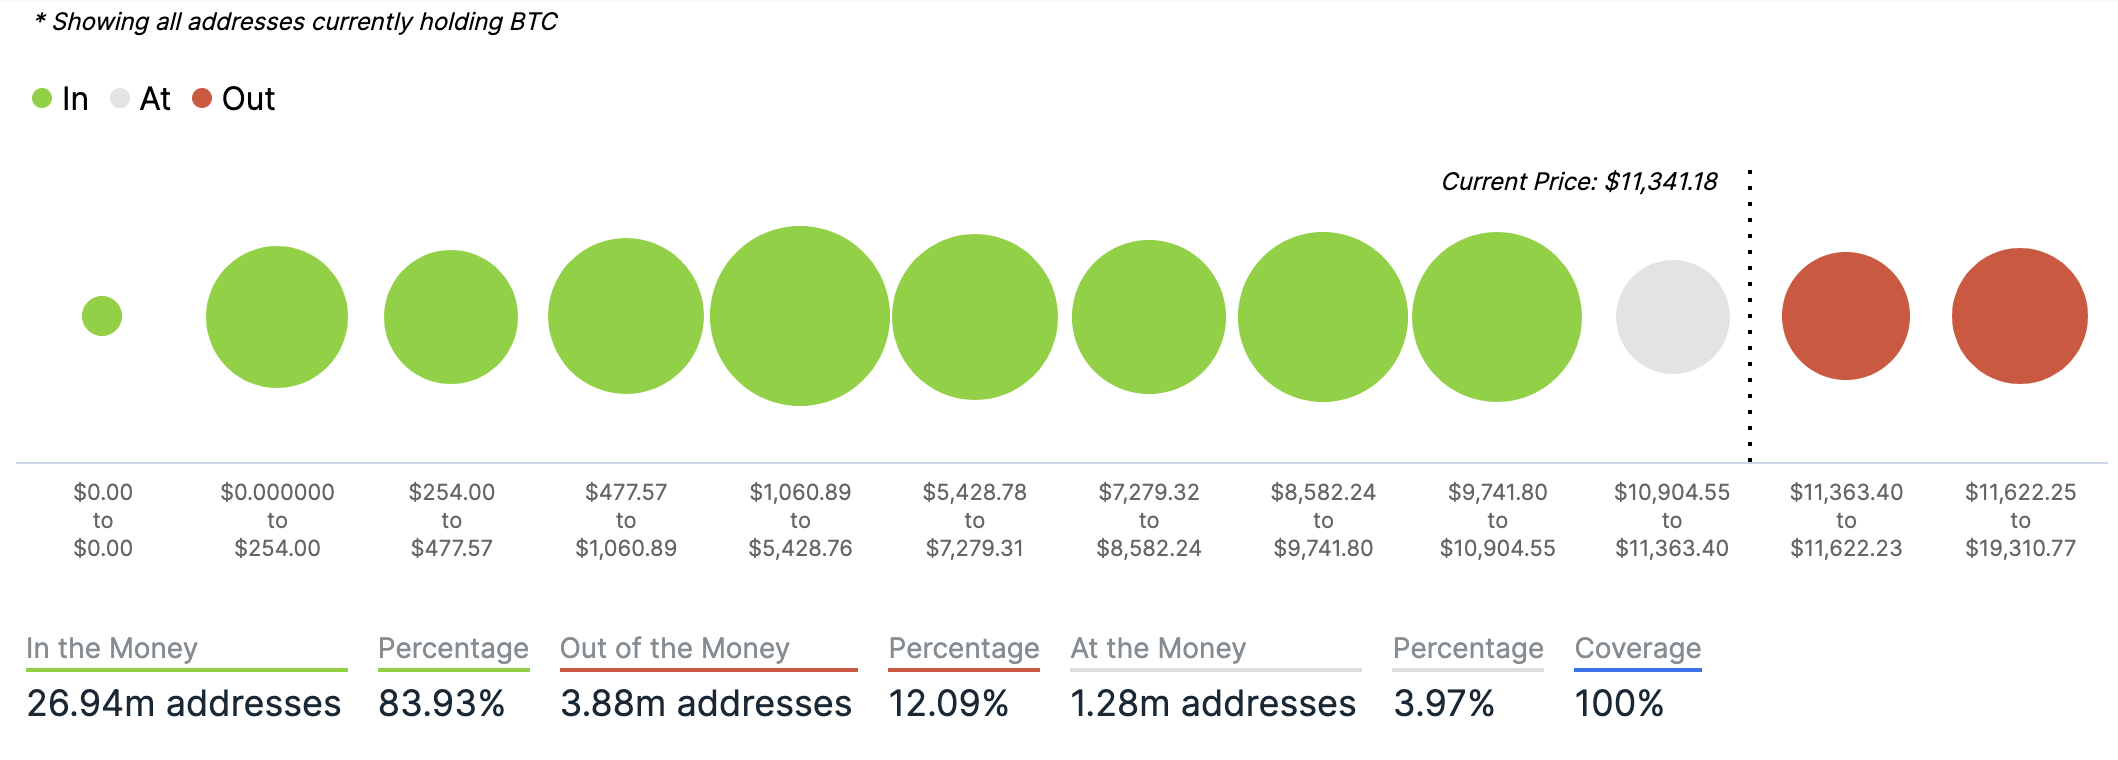
Chart provided by IntoTheBlock.com
Volatility
Annualised price volatility using 365 days.
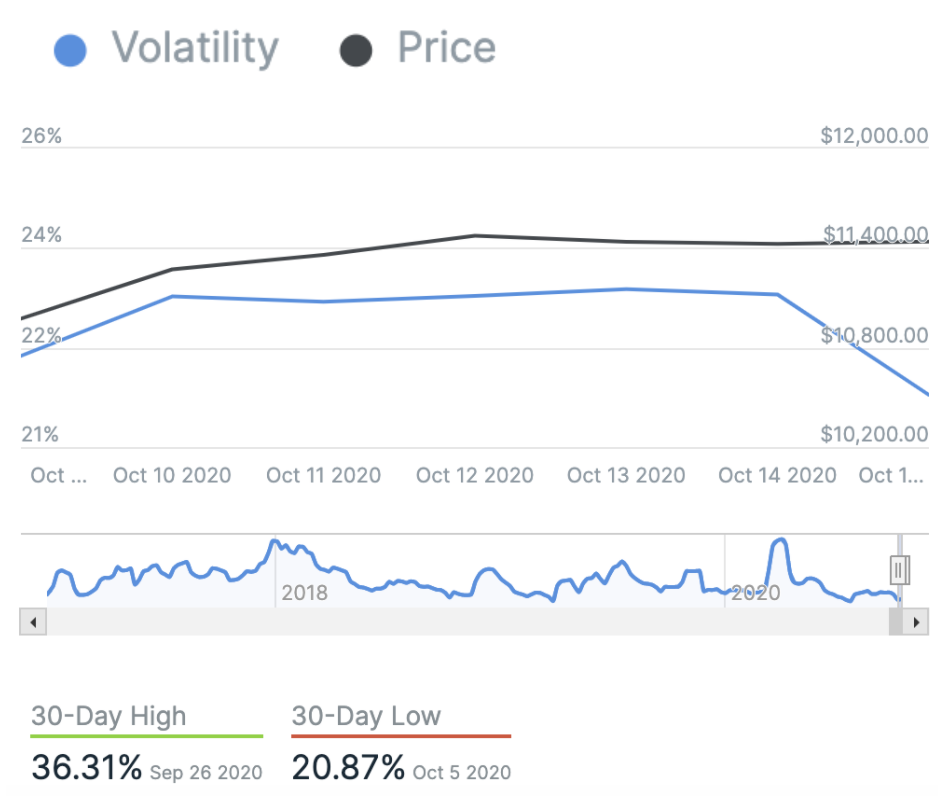
Chart provided by IntoTheBlock.com
Bitcoin’s market dominance
Bitcoin’s market dominance stands at 60.32. Its lowest recorded dominance was 37.09 on 8 January, 2018.
Relative Strength Index (RSI)
The daily RSI is currently 59.23. Values of 70 or above indicate that an asset is becoming overbought and may be primed for a trend reversal or experience correction in price – an RSI reading of 30 or below indicates an oversold or undervalued condition.
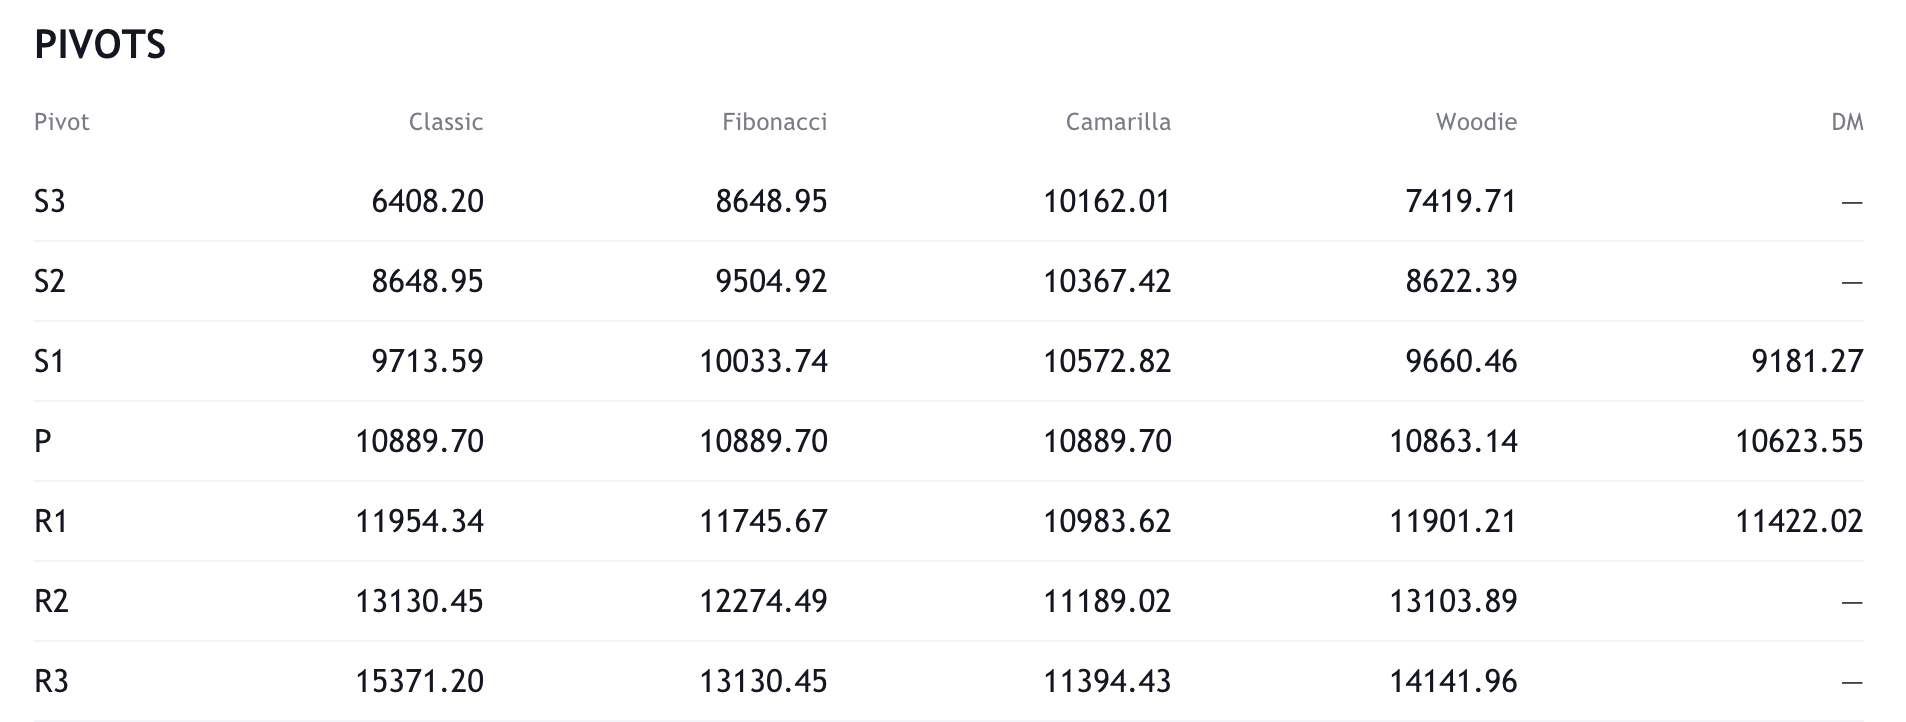
Resistance and support
What they said yesterday…
Google Finance now has Bitcoin as the 1st currency!
h/t @Leishman pic.twitter.com/rb8McA2QTw
— Dan Held (@danheld) October 15, 2020
84k BTC were mined in Q3. Just CashApp, Square & Microstrategy account for 169% of that. Grayscale accounts for another 70% (not necessarily all new purchases). Given lack of price movement, feels like there is a major seller in the market. When seller runs out of coins… moon.
— Ben Davenport (@bendavenport) October 16, 2020
Fed Chairman Powell will speak about digital currencies next week on IMF panel
by @kreyofcoindesk https://t.co/RPCxGO2jyL
— CoinDesk (@CoinDesk) October 15, 2020
What other data points would you like to see covered in our Daily Report? Let us know on Twitter.
Did you find this useful?