Discover
 Help Centre
 Status
 Company
 Careers
 Press
PressDaily market update: “Grayscale Investments believes that the Bitcoin markets appear poised for a historic bull run”

The world moves fast, but crypto moves faster. That’s why we’re here, every day, with all the metrics you need to help you decide whether you want to buy, sell, trade, or hodl.
If you’re new to the world of crypto trading, take a look through our beginner’s guide to crypto trading series, starring in-depth explorations of common strategies, market analysis techniques, AND MORE.
The content of this article is for information purposes only and is not investment advice or any form of recommendation or invitation. Luno always advises you to obtain your own independent financial advice before investing or trading in cryptocurrency.
Bitcoin price
We closed yesterday, 20 August 2020, at a price of $11,878.37 – with a daily high of $11,900.41 and a low of $11,710.06.
The closing price is up $120.09 from yesterday’s, which was $11,758.28. On the same day last year, Bitcoin closed at $10,763.23. As of today, buying bitcoin has been profitable for 97% of all days since 2013-04-28.
We’re 39.8% below Bitcoin‘s all-time high of $20,089 (17 December 2017).
Market capitalisation
Bitcoin’s market capitalisation as of yesterday was $219,350,310,326, up from $217,122,068,305 yesterday. To put that into context, Jeff Bezos’s net worth is $188,500,000,000, which means he could only buy 85.9% of all Bitcoin. You can’t have everything, Jeff!
Bitcoin volume
The volume traded yesterday was $20,175,242,945. That’s the lowest it’s been since 9 August 2020.
To put that into context, the highest ever 24-hour volume is $53,060,690,000, last year’s high was $29,060,690,000, and last year’s average was $15,060,690,000.
Bitcoin’s market dominance
Bitcoin’s market dominance stands at 60.87, down from 61.34 yesterday despite a drop in price as alts took a hit across the board. Its lowest recorded dominance was 37.09 on 8 January, 2018.
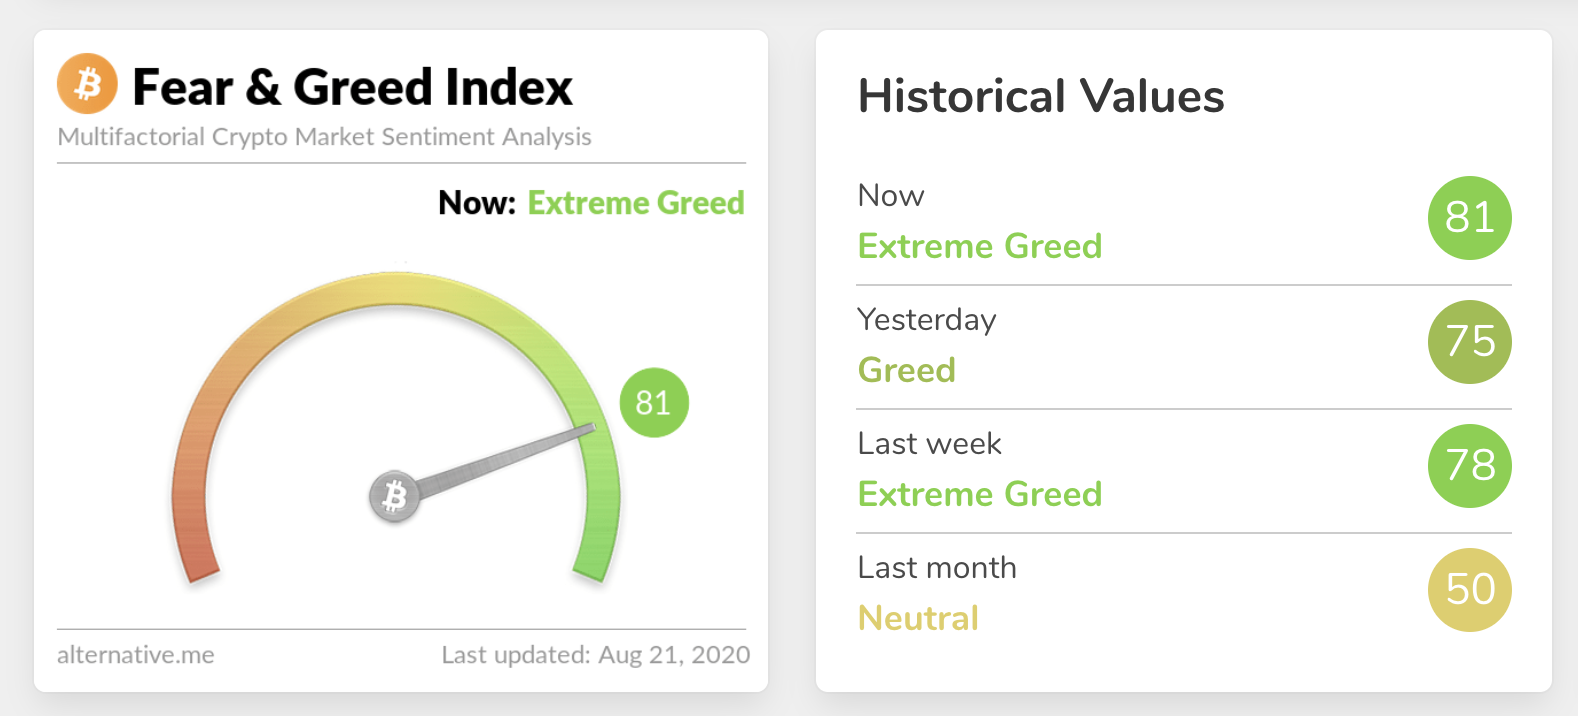
Fear and Greed Index
We’re back in the Extreme Greed zone, up from 75 to 81. Extreme fear can be a sign that investors are too worried, which could be a buying opportunity. When Investors are getting too greedy, that means the market may be due for a correction.
Relative Strength Index (RSI)
The daily RSI is currently 58.95. Values of 70 or above indicate that an asset is becoming overbought and may be primed for a trend reversal or experience correction in price. – an RSI reading of 30 or below indicates an oversold or undervalued condition.
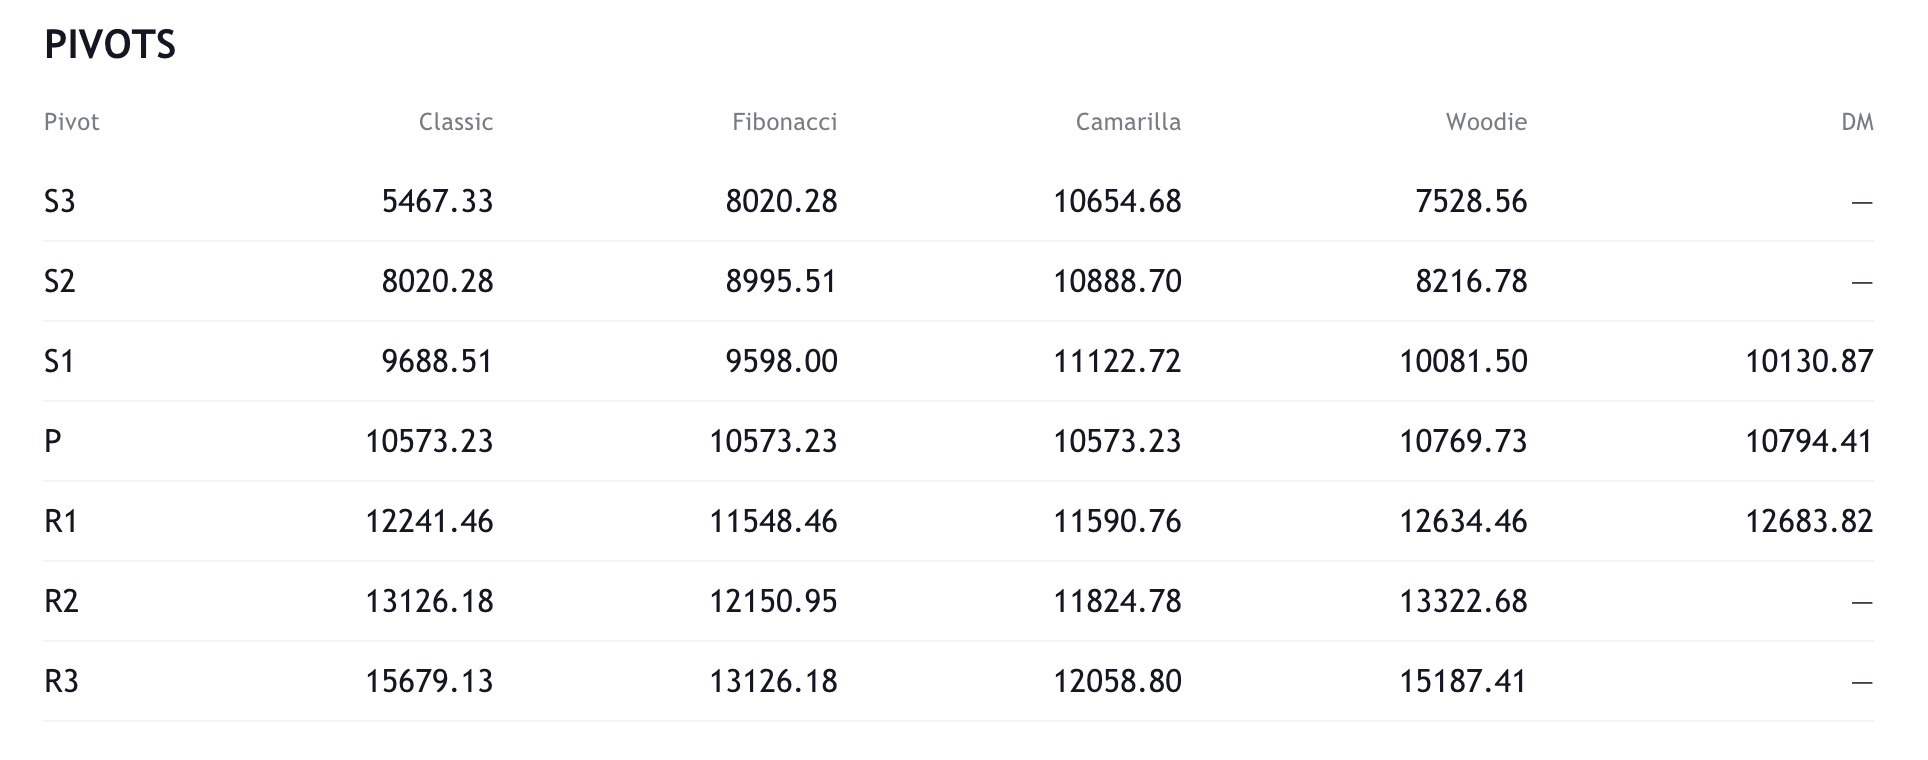
Resistance and support
What they said yesterday…
Grayscale Investments believes that the Bitcoin markets appear poised for a historic bull run as quantitative easing drives surging demand https://t.co/JZhwuQgCre
— Cointelegraph (@Cointelegraph) August 21, 2020
The most amazing thing about Satoshi’s invention is that Bitcoin will continue on forever. Blocks will continue at the same rate because it’s self-adjusting to any hashrate changes. The incentives structure and game theory is so simple yet so brilliant.
(h/t @BVBTC for image) pic.twitter.com/VA6f79j5ml
— Charlie Lee [LTC⚡] (@SatoshiLite) August 21, 2020
Imagine if Satoshi stopped building #Bitcoin because of internet meanies. Build and DGAF is Satoshi’s style. We don’t have time to explain it to you. pic.twitter.com/Zej5MqBcJE
— grubles (@notgrubles) August 20, 2020
What other data points would you like to see covered in our Daily Report? Let us know on Twitter.
Did you find this useful?