Discover
 Help Centre
 Status
 Company
 Careers
 Press
PressDaily market update: Institutions ditching gold for Bitcoin?

What a week that was! There was the US election that dragged on for eternity, but far more importantly than that, Bitcoin closed its third-highest week ever. Is this the start of a run to a new all-time high, or just the peak of this year’s bull run?
Make your mind up for yourself with your daily look at the latest bitcoin market movements. If you’re new to the world of crypto trading and want to understand more about what this means and how to use it, take a look through our beginner’s guide to crypto trading series, featuring in-depth explorations of common strategies, market analysis techniques, and more.
The content of this article is for information purposes only and is not investment advice or any form of recommendation or invitation. Luno always advises you to obtain your own independent financial advice before investing or trading in cryptocurrency.
All information is correct as of 08:30am GMT.
Bitcoin price
We closed yesterday, 8 November, 2020, at a price of $15,479.57, up from $14,833.75 the day before – an increase of 4.35%. That’s the third-highest ever weekly close in Bitcoin’s short but illustrious history.
The daily high was $15,637.32 and the daily low was $14,744.11. That’s the fifth day in a row we’ve had a high over $15,000.
We’re 22.95% below bitcoin‘s all-time high of $20,089 (17 December 2017).
As of today, buying bitcoin has been profitable for…
98.9% of all days since 2013-04-28.
Bitcoin volume
The volume traded yesterday was $26,632,075,029, down from $35,024,953,706 the day before. High volume indicates that a significant price movement has stronger support and is more likely to be sustained.
Market capitalisation
Bitcoin’s market capitalisation as of yesterday was $286,955,182,899, up from $274,970,333,140 the day before.
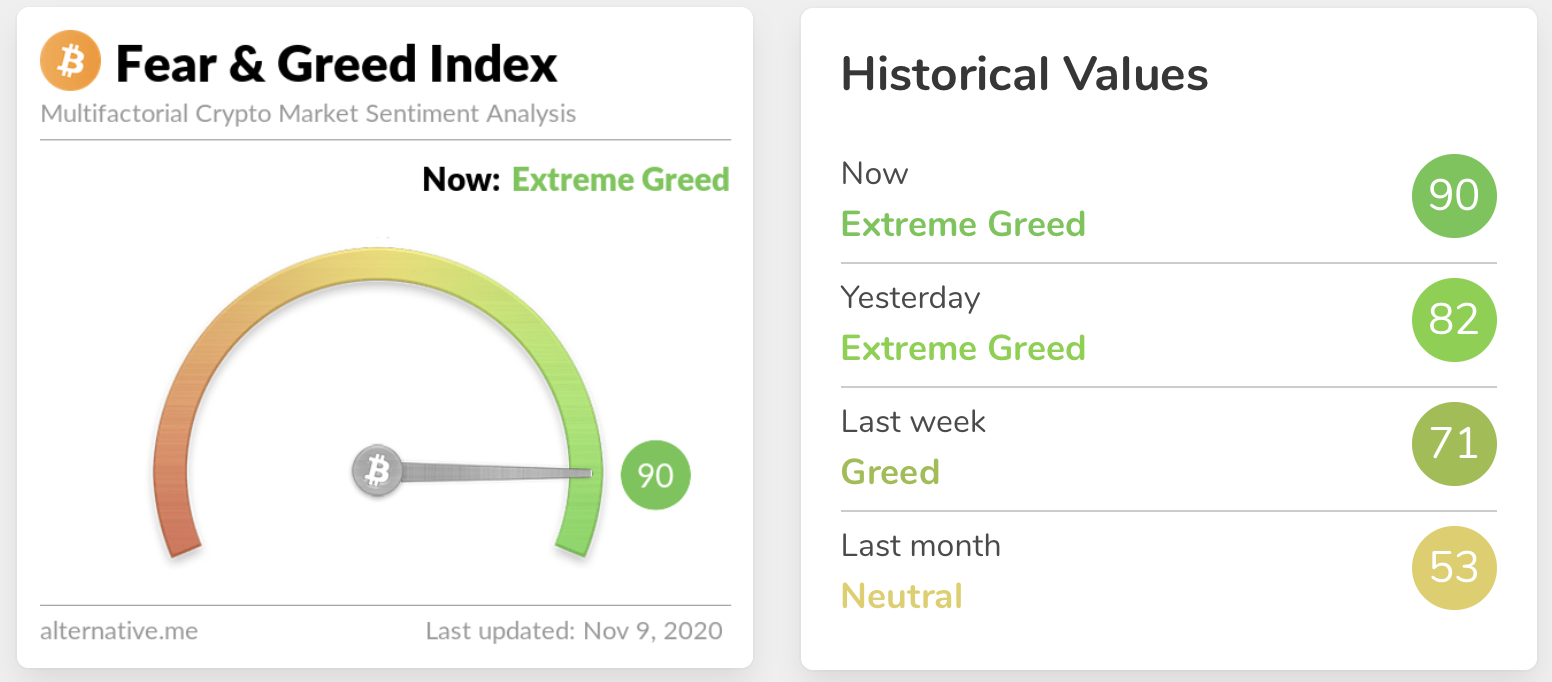
Fear and Greed Index
The sentiment picks up where we left off on Friday – up in Extreme Greed at 90 after a weekend spent down in the lowly 80s (which is still Extreme Greed). Extreme fear can indicate that investors are getting too worried and there’s an opportunity for buyers, while extreme greed could mean the market is due for a correction.
In/Out of the money
For any address with a balance of tokens, ITB identifies the average price (cost) at which those tokens were purchased and compares it with the current price. If the current price is higher than average cost, address is ‘In the Money’. If the current price is lower than the average cost, the address is ‘Out of the Money’.
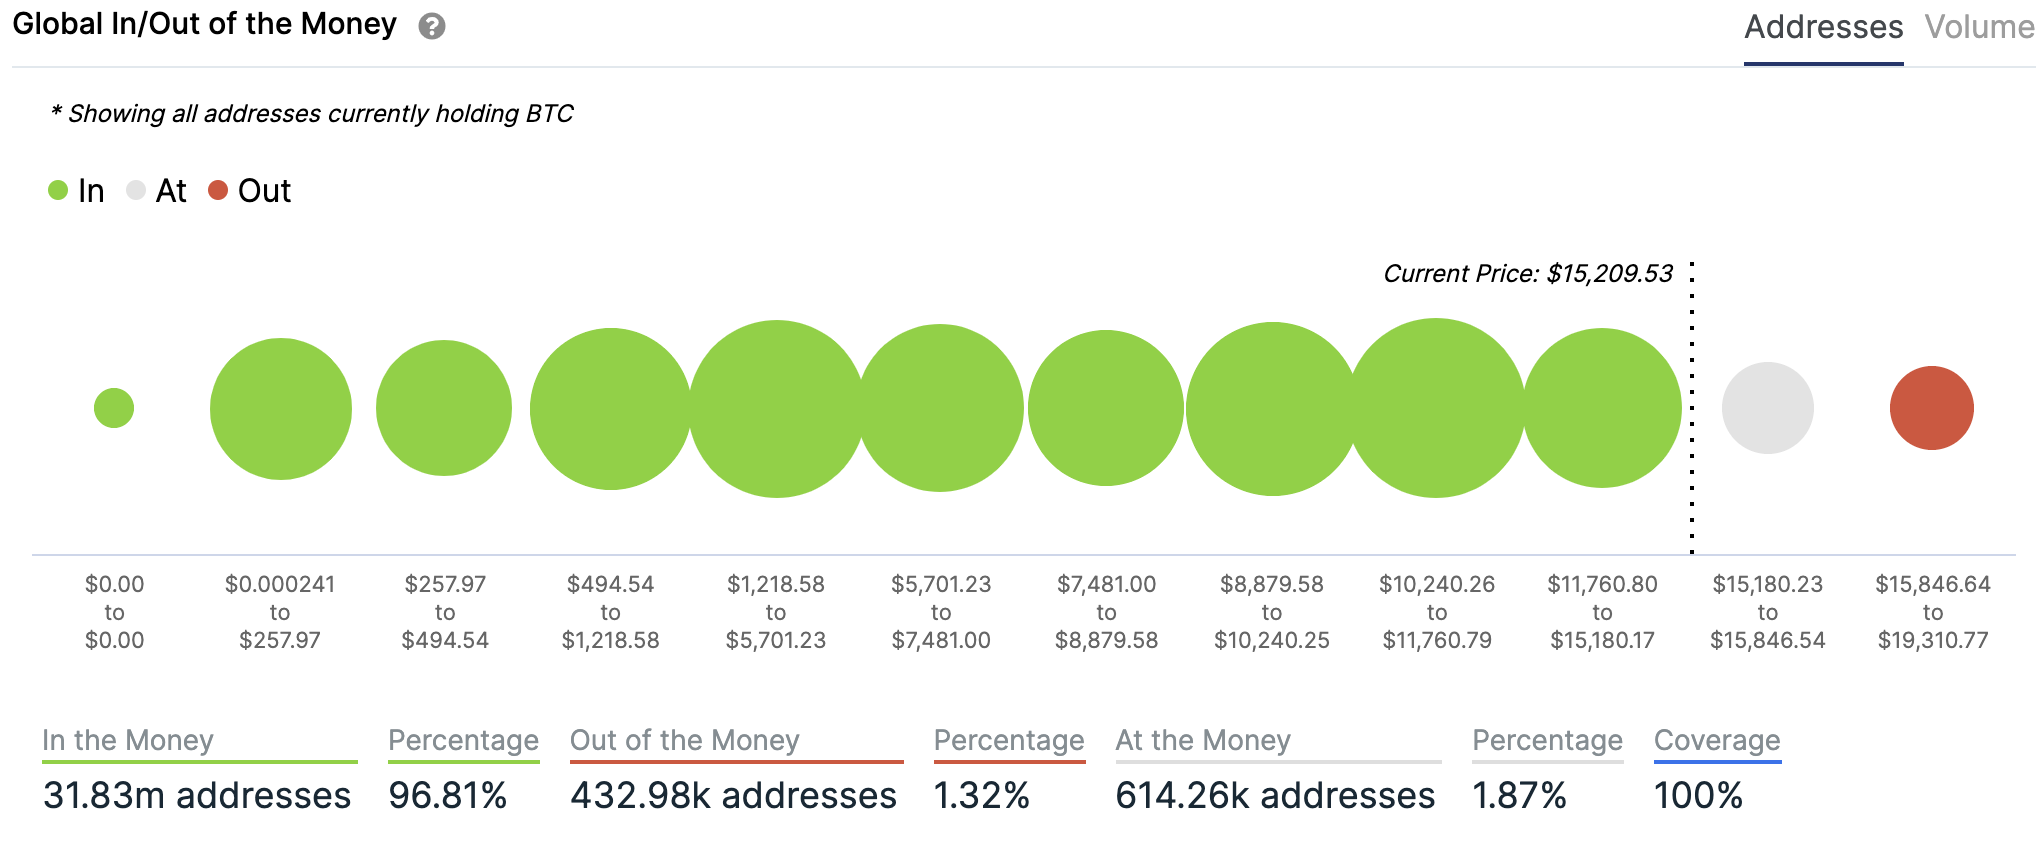
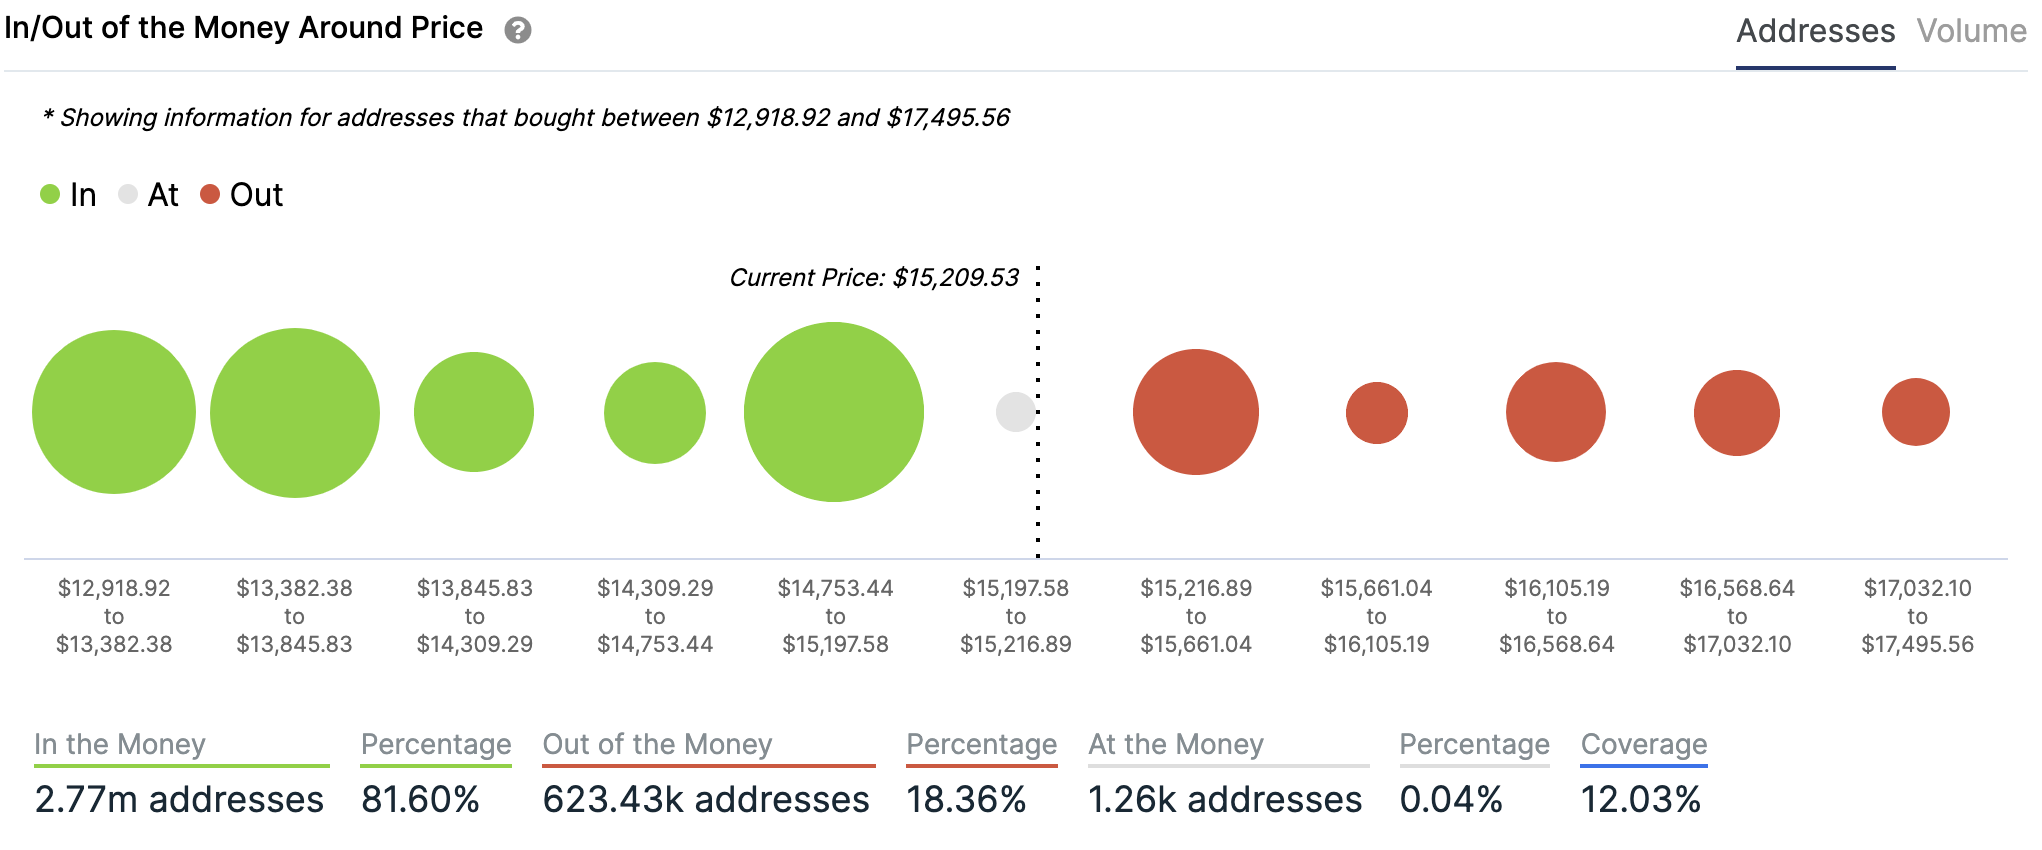
Charts provided by IntoTheBlock.com
Volatility
Annualised price volatility using 365 days.
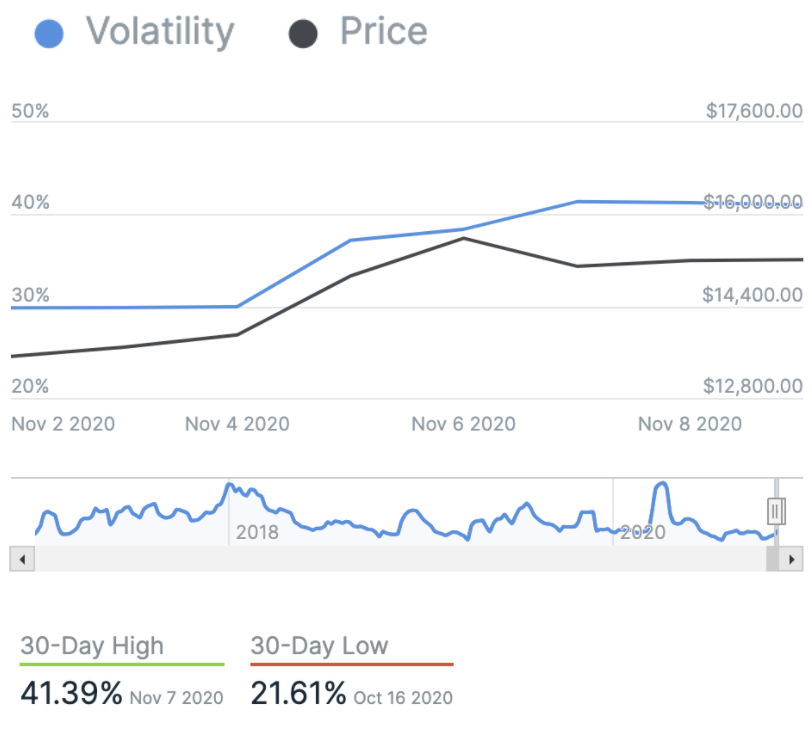
Chart provided by IntoTheBlock.com
Twitter sentiment
Yesterday, there were 9,491 tweets sent with a positive connotation towards bitcoin, 20,397 with a neutral connotation, and 1,558 were negative.
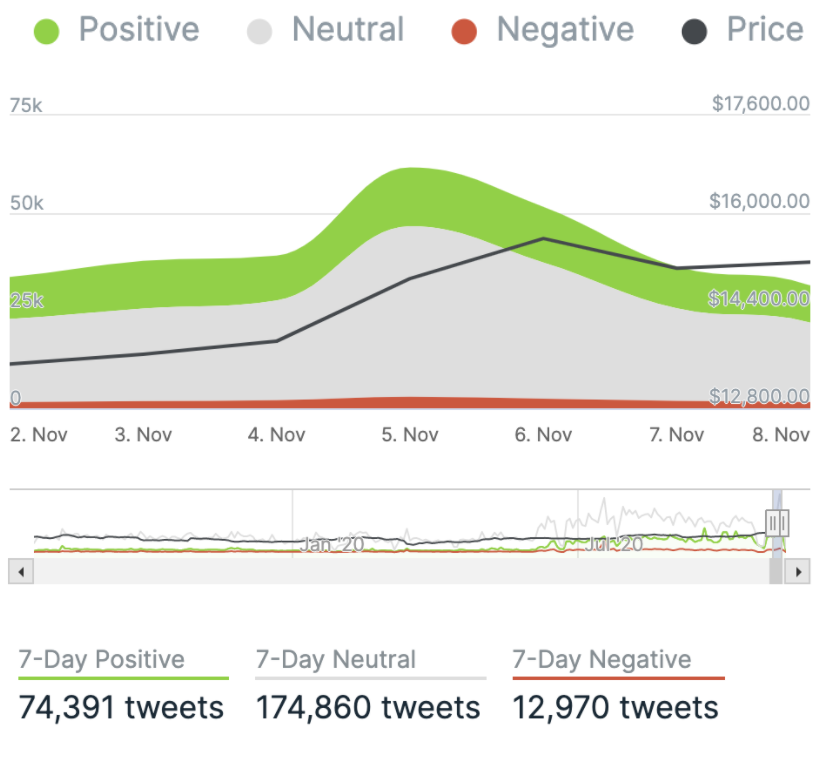
Chart provided by IntoTheBlock.com
Bitcoin’s market dominance
Bitcoin’s market dominance stands at 65.08. Its lowest recorded dominance was 37.09 on 8 January, 2018.
Relative Strength Index (RSI)
The daily RSI is currently 69.30. Values of 70 or above indicate that an asset is becoming overbought and may be primed for a trend reversal or experience a correction in price – an RSI reading of 30 or below indicates an oversold or undervalued condition.
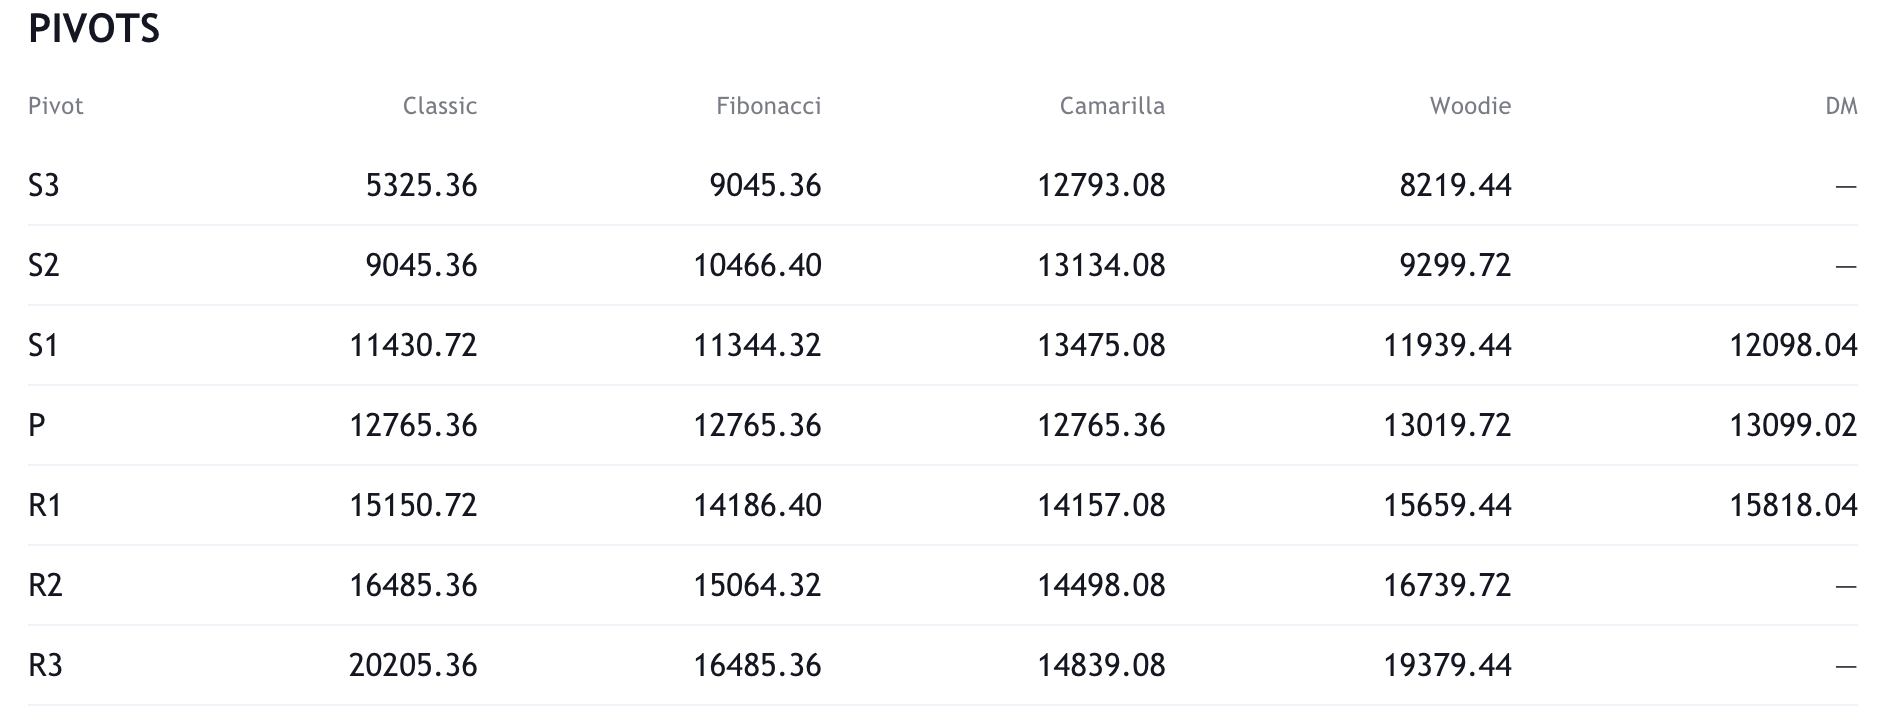
Resistance and support
What they said yesterday…
“There’s more demand for Grayscale’s #Bitcoin Trust than all gold ETFs combined, according to JPMorgan”
— Erik Voorhees (@ErikVoorhees) November 8, 2020
JPMorgan Says Institutions Ditching Gold ETFs for Bitcoin https://t.co/Z1bHmPs6mt
— Barry Silbert (@BarrySilbert) November 8, 2020
3rd highest weekly close ever.#Bitcoin bull market is coming.
— Jimmy Song (송재준) (@jimmysong) November 9, 2020
Ok 2020 is weird, now @Nouriel Roubini calls #Bitcoin maybe a store of value….
h/t @PsychedelicBart pic.twitter.com/2Kz23eXGGF
— Bitcoin Meme Hub ? (@BitcoinMemeHub) November 9, 2020
What other data points would you like to see covered in our Daily Report? Let us know on Twitter.
Did you find this useful?