Discover
 Help Centre
 Status
 Company
 Careers
 Press
PressDaily market update: Is BTC poised for a $14K breakout?

Bitcoin continues to maintain its hold above $13,000. Volumes and sentiment are also keeping pace. Is $14K next?
The indicators are flashing green across the board. Let’s take a closer look to find out what exactly is going on. If you’re new to the world of crypto trading, take a look through our beginner’s guide to crypto trading series, starring in-depth explorations of common strategies, market analysis techniques, and more.
The content of this article is for information purposes only and is not investment advice or any form of recommendation or invitation. Luno always advises you to obtain your own independent financial advice before investing or trading in cryptocurrency.
All information is correct as of 11:00am SAST.
Bitcoin price
We closed yesterday, 27 October, 2020, at a price of $13,654.22 with a daily high of $13,759.67 and a low of $13,060.84. That’s four consecutive daily closes over $13,000 and 93 consecutive daily closes over $10,000.
We’re 32.03% below bitcoin‘s all-time high of $20,089 (17 December 2017).
As of today, buying bitcoin has been profitable for…
98.4% of all days since 2013-04-28.
Bitcoin volume
The volume traded yesterday was $33,749,878,156 – up from $29,461,458,313 the day before. That’s the highest daily trading volume since 21 October. High volume indicates that a significant price movement has stronger support and is more likely to be sustained.
Market capitalisation
Bitcoin’s market capitalisation as of yesterday was $252,985,946,390, up from $242,250,997,936 the day before.
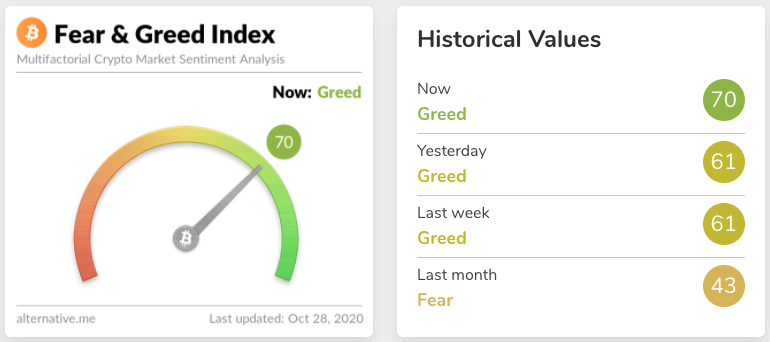
Fear and Greed Index
We’re still in the green at 70, up from 61 the day before. This isn’t necessarily a bad thing – while extreme fear can indicate that investors are too worried, when investors are getting too greedy that means the market may be due for a correction.
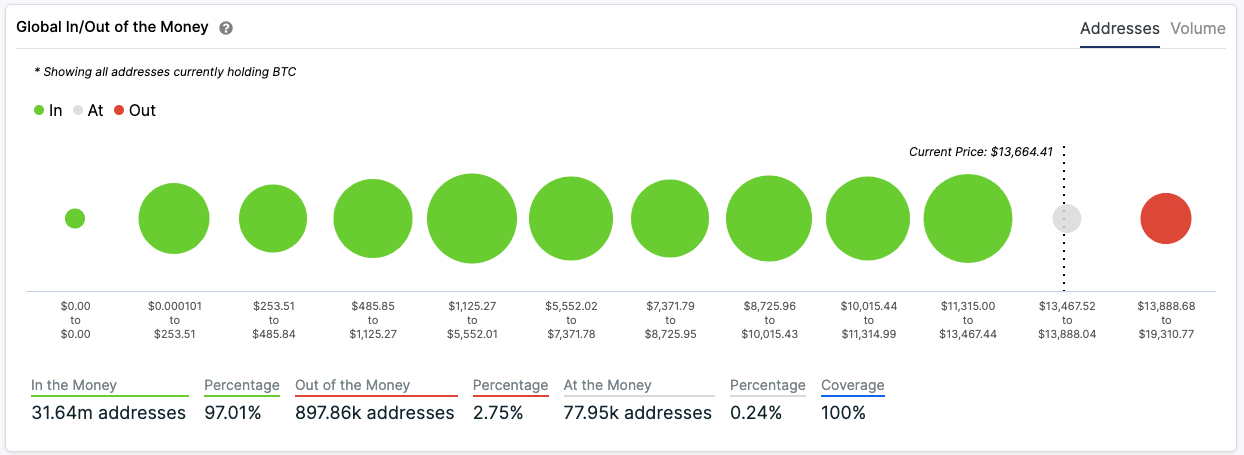
Global In/Out of the money
For any address with a balance of tokens, ITB identifies the average price (cost) at which those tokens were purchased and compares it with the current price. If the current price is higher than average cost, address is ‘In the Money’. If the current price is lower than the average cost, the address is ‘Out of the Money’.
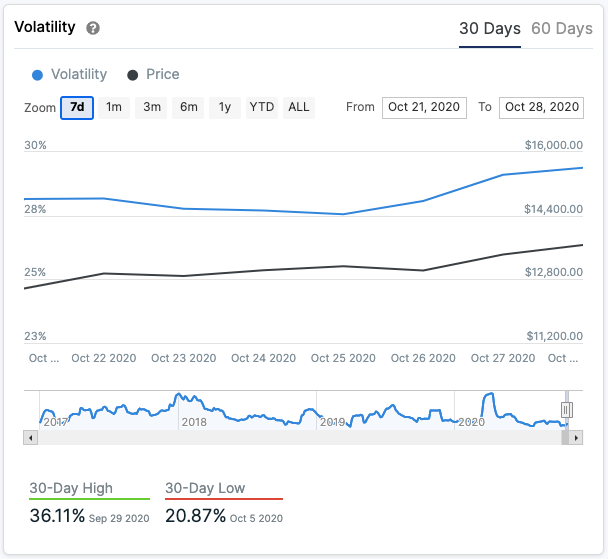
Volatility
Annualised price volatility using 365 days.
Bitcoin’s market dominance
Bitcoin’s market dominance stands at 63.27. Its lowest recorded dominance was 37.09 on 8 January, 2018.
Relative Strength Index (RSI)
The daily RSI is currently 83.54. Values of 70 or above typically indicate that an asset is becoming overbought and may be primed for a trend reversal or experience correction in price – an RSI reading of 30 or below indicates an oversold or undervalued condition.
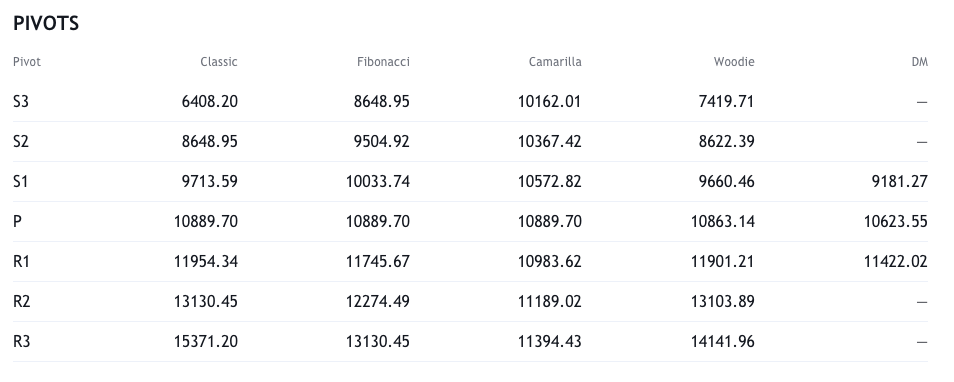
Resistance and support
What they said yesterday…
Bitcoin’s performance is SO dominant and SO all-encompassing that it is going to suck in every single asset narrative dry and spit it out.
Never before in my career have I see a trade so dominant that holding any other assets makes almost no sense.
— Raoul Pal (@RaoulGMI) October 27, 2020
Paul Tudor Jones, @jack, @jimcramer, @novogratz, @michael_saylor, @genesimmons, and many more all have massive life success and #Bitcoin in common. If you don’t own bitcoin right now, you have to ask yourself what exactly it is that you know and they don’t.
— Tyler Winklevoss (@tyler) October 27, 2020
Bitcoin approaches levels not seen since just after the burst of the cryptocurrency bubble almost three years ago https://t.co/kAZrgVfTC2
— Bloomberg Crypto (@crypto) October 27, 2020
What other data points would you like to see covered in our Daily Report? Let us know on Twitter.
Did you find this useful?