Discover
 Help Centre
 Status
 Company
 Careers
 Press
PressDaily market update: Negative UK interest rates bullish news for bitcoin?


Here’s today’s stat attack. If you’re new to the world of crypto trading, don’t forget to take a look through our beginner’s guide to crypto trading series, starring in-depth explorations of common strategies, market analysis techniques, and more.
The content of this article is for information purposes only and is not investment advice or any form of recommendation or invitation. Luno always advises you to obtain your own independent financial advice before investing or trading in cryptocurrency.
All information is correct as of 10.00am BST.
Bitcoin price
We closed yesterday, 17 September, 2020, at a price of $10,948.99 – with a daily high of $11,037.42 and a low of $10,774.63.
That’s up from a closing price of $10,974.90 the day before. On the same day last year, one bitcoin would have set you back $10,241.27.
We’re 45.5% below bitcoin‘s all-time high of $20,089 (17 December 2017).
As of today, buying bitcoin has been profitable for…
94.4% of all days since 2013-04-28.
Bitcoin volume
The volume traded yesterday was $38,151,810,523 – up from $30,769,986,455 the day before. That’s the highest daily volume since 11 September 2020.
Market capitalisation
Bitcoin’s market capitalisation as of yesterday was $202,475,761,712, down from $202,942,925,722 the day before. To put that into context, Jeff Bezos is now worth $184.9 billion after tech stocks plunged recently. This means he can only afford to buy 91.1% of all bitcoin. Better luck next time, Jeff.
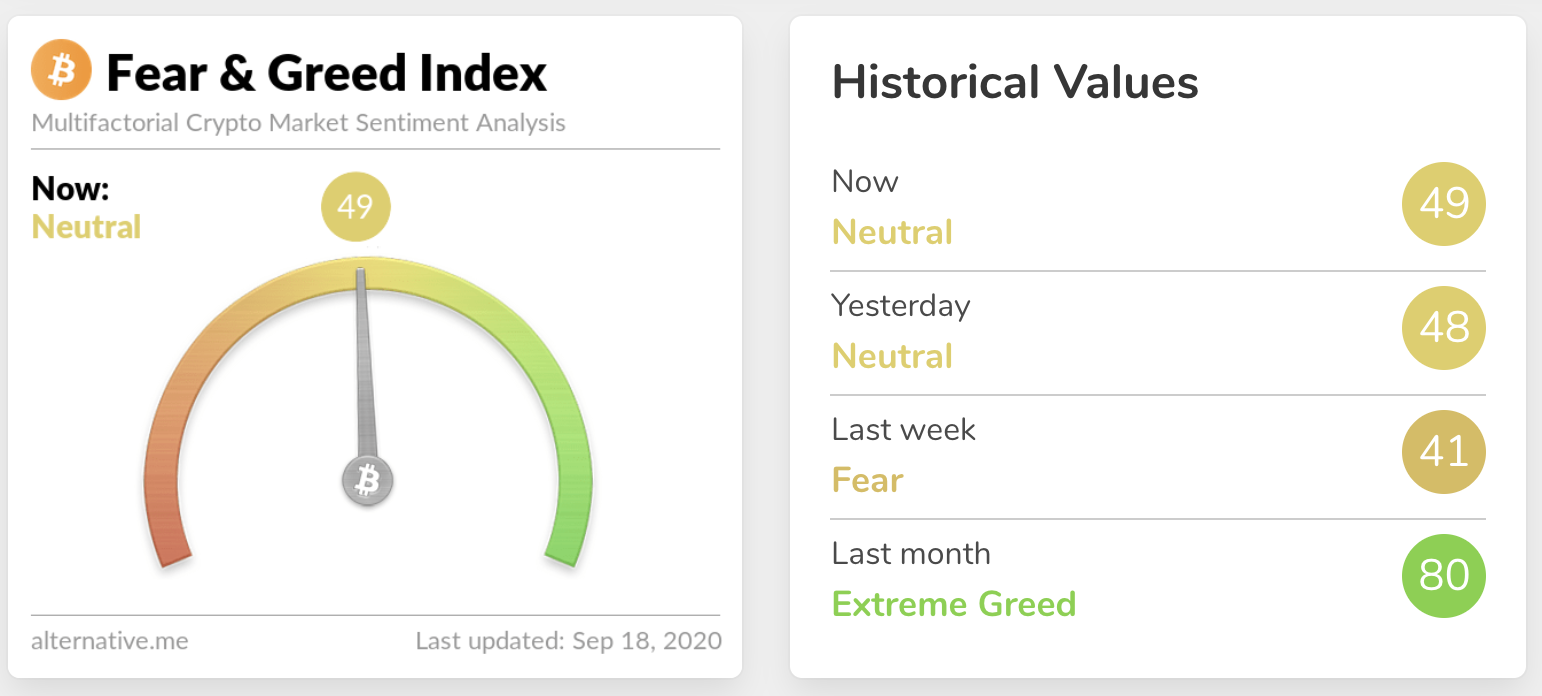
Fear and Greed Index
With more upwards price action, sentiment is up again from 48 to 49 – its highest level since 3 September.
Extreme fear can be a sign that investors are too worried, which could be a buying opportunity. When Investors are getting too greedy, that means the market may be due for a correction.
Global In/Out of the money
For any address with a balance of tokens, ITB identifies the average price (cost) at which those tokens were purchased and compares it with the current price. If the current price is higher than average cost, address is ‘In the Money’. If the current price is lower than the average cost, the address is ‘Out of the Money’.
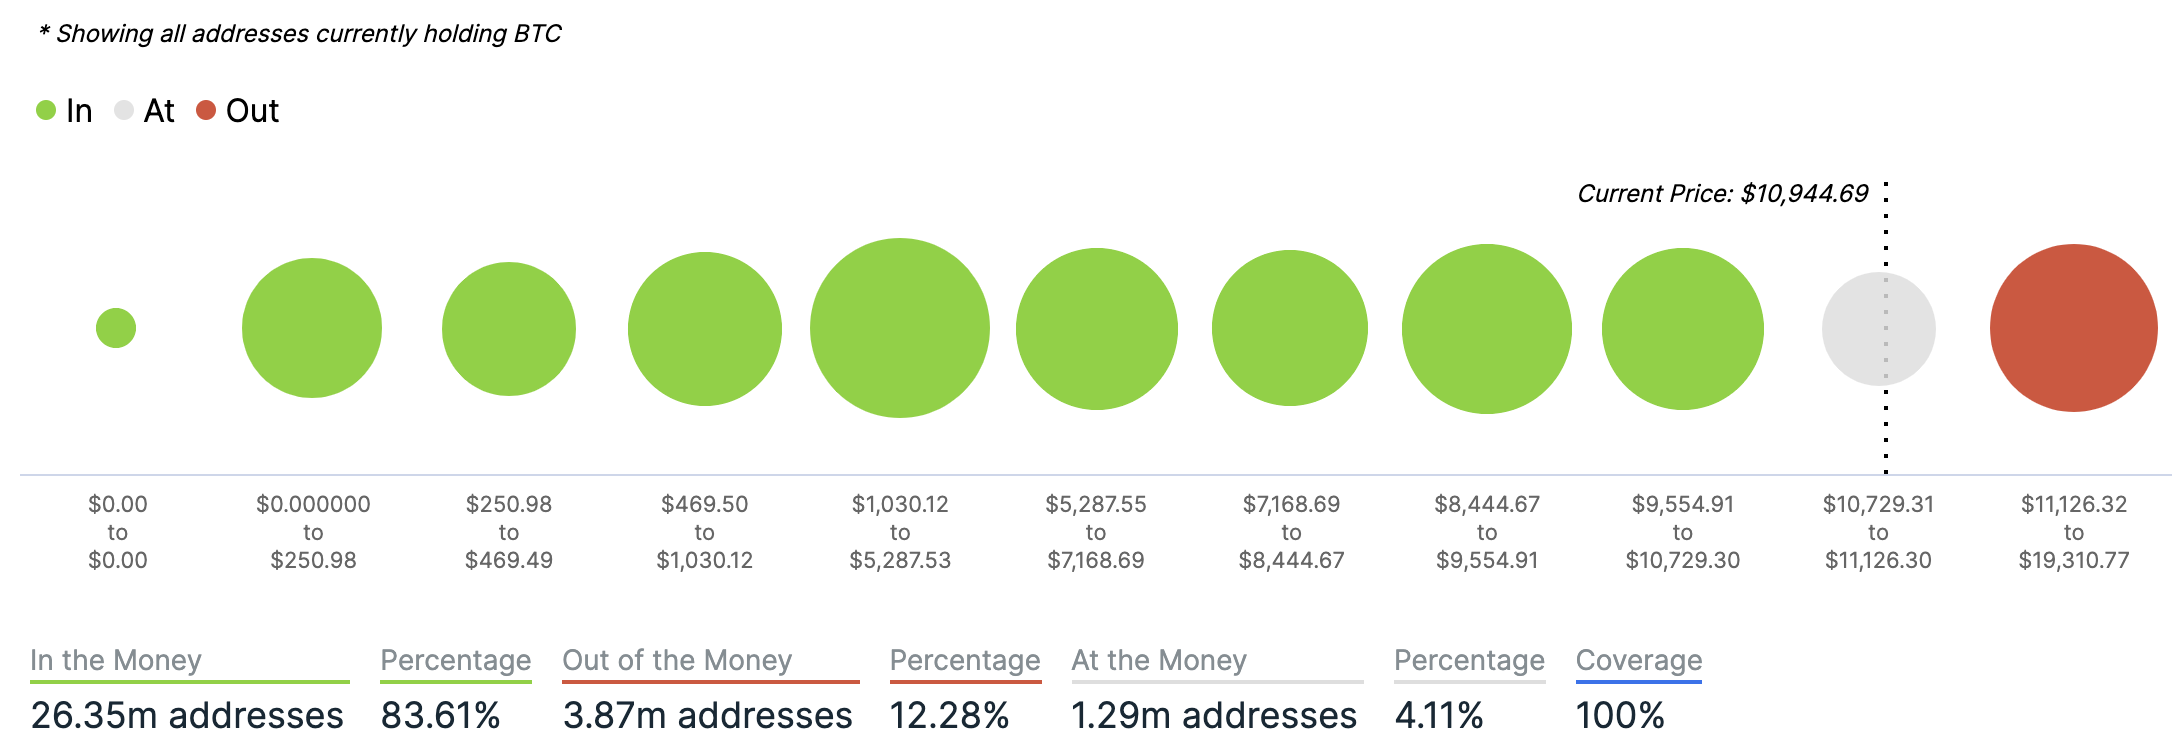
Chart courtesy of IntoTheBlock.com
Volatility
Annualised price volatility using 365 days.
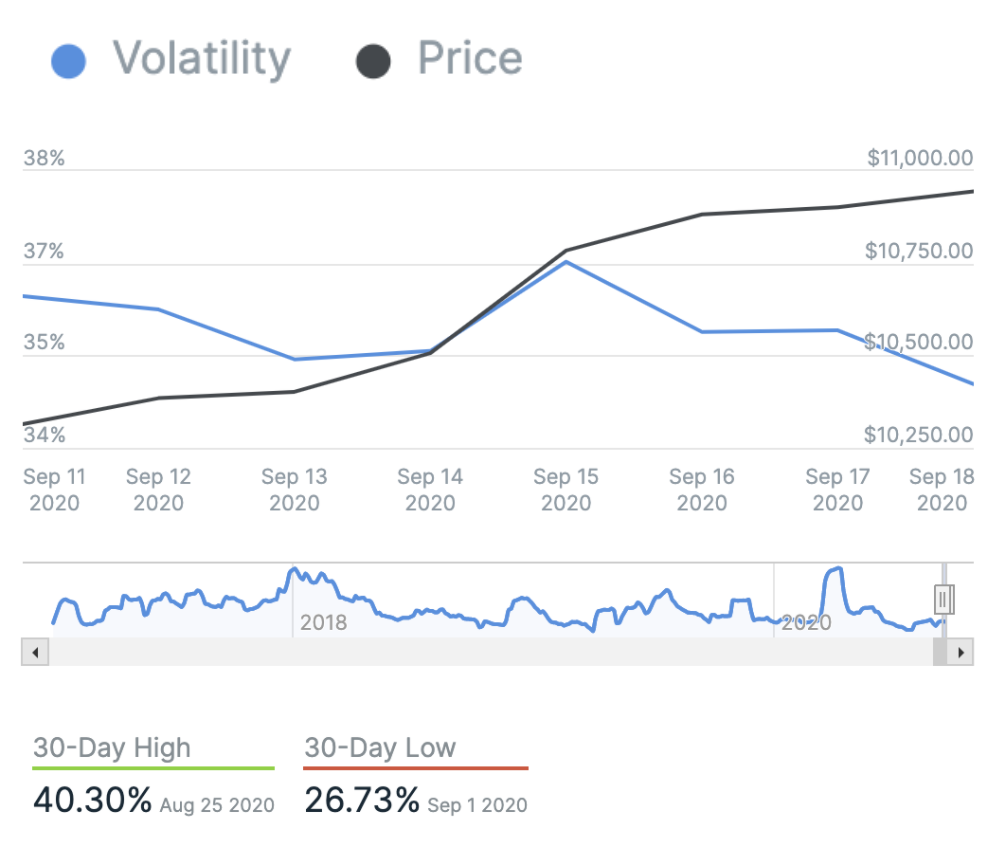
Chart courtesy of IntoTheBlock.com
Bitcoin’s market dominance
Bitcoin’s market dominance stands at 60.57. Its lowest recorded dominance was 37.09 on 8 January, 2018.
Relative Strength Index (RSI)
The daily RSI is currently 52.849. Values of 70 or above indicate that an asset is becoming overbought and may be primed for a trend reversal or experience correction in price – an RSI reading of 30 or below indicates an oversold or undervalued condition.
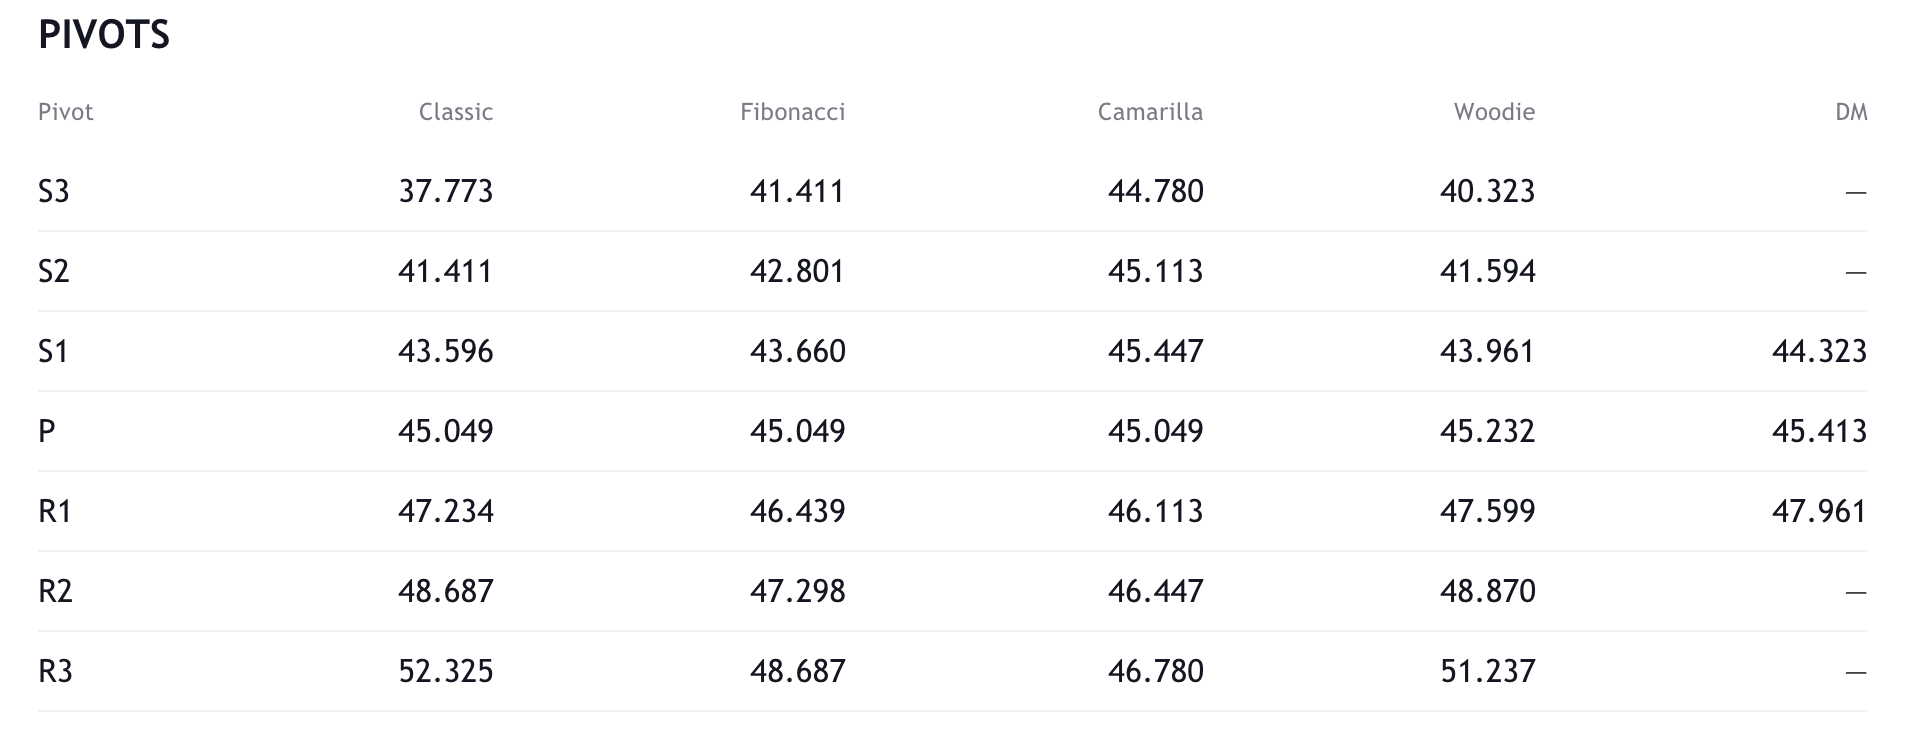
Resistance and support
What they said yesterday…
We acquired 21,454 BTC via 78,388 off-chain transactions, then secured it in cold storage with 18 on-chain transactions. #Bitcoin scales just fine as a store of value.
— Michael Saylor (@michael_saylor) September 17, 2020
Wow, the Bank of England discussing negative interest rates. If they adopt this, they would be paying you to borrow. You couldn’t buy a better advertisement for #Bitcoin but u can take their money and go long bitcoin ?? https://t.co/Bjdos2Ml2l
— Tyler Winklevoss (@tylerwinklevoss) September 17, 2020
Bitcoiners are the smartest investors on earth…
— Ivan on Tech (@IvanOnTech) September 17, 2020
What other data points would you like to see covered in our Daily Report? Let us know on Twitter.
Did you find this useful?