Discover
 Help Centre
 Status
 Company
 Careers
 Press
PressDaily market update: Square buys $50 million in bitcoin before price jump

Another day, another company buying a crap load of bitcoin to make sure their finances are positioned to survive these turbulent times. This time, Jack Dorsey’s Square is leading the charge. Dorsey is well known as a bitcoin bull, but this is one of the biggest corporate bets we’ve seen yet – and it looks like it was good news for the price, with a $300 bounce following the news.
If you’re new to the world of crypto trading and want to know how to best use these indicators to trade, don’t forget to take a look through our beginner’s guide to crypto trading series, featuring in-depth explorations of common strategies, market analysis techniques, and more.
The content of this article is for information purposes only and is not investment advice or any form of recommendation or invitation. Luno always advises you to obtain your own independent financial advice before investing or trading in cryptocurrency.
All information is correct as of 10:30am BST.
Bitcoin price
We closed yesterday, 8 October, 2020, at a price of $10,923.63, with a daily high of $10,939.80 and a low of $10,569.82. That’s the highest daily closing price since 20 September.
On 8 October, 2019, the closing price was $8,228.78. On 8 October, 2018, it was $6,652.23 and the same date in 2017 was $4,610.48.
We’re 45.62% below bitcoin‘s all-time high of $20,089 (17 December 2017).
Bitcoin volume
The volume traded yesterday was $21,962,121,001 – up from $17,634,388,529 the day before.
Market capitalisation
Bitcoin’s market capitalisation as of yesterday was $202,215,604,969, up from $197,678,953,704 the day before. To put that into context, Jeff Bezos is currently worth $175.3 billion. This means he can only afford to buy 88.69% of all bitcoin. Not a great way to end the week for Jeff, further away than when he started.
As of today, buying bitcoin has been profitable for…
94.2% of all days since 2013-04-28.
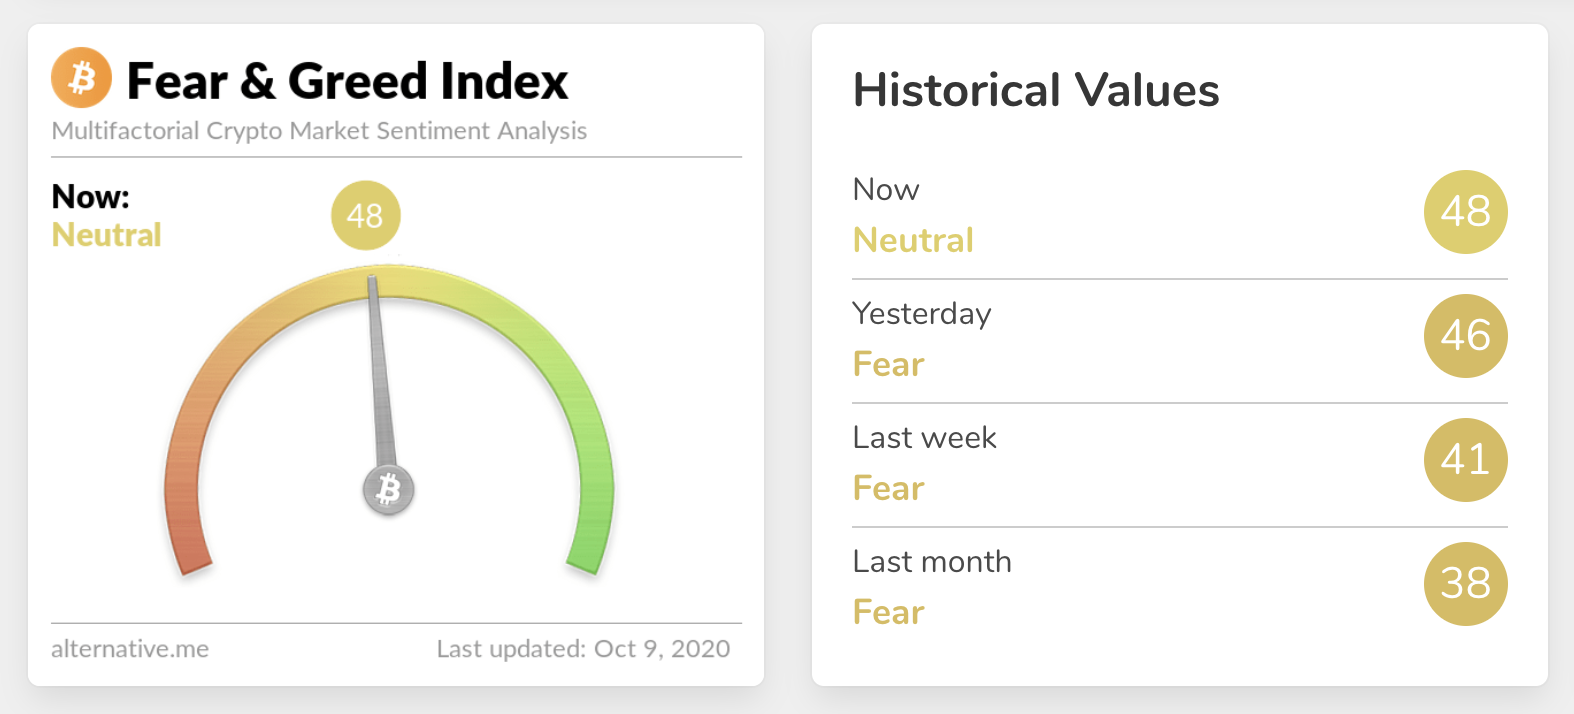
Fear and Greed Index
Sentiment is at 48 – up from 46 yesterday. That’s the highest level we’ve seen so far in October. Extreme fear can be a sign that investors are too worried, which could be a buying opportunity. When Investors are getting too greedy, that means the market may be due for a correction. Are we set for a big move?
Twitter sentiment
Yesterday, there were 13,741 tweets sent with a positive connotation towards bitcoin, 25,668 with a neutral connotation, and 1,888 were negative.
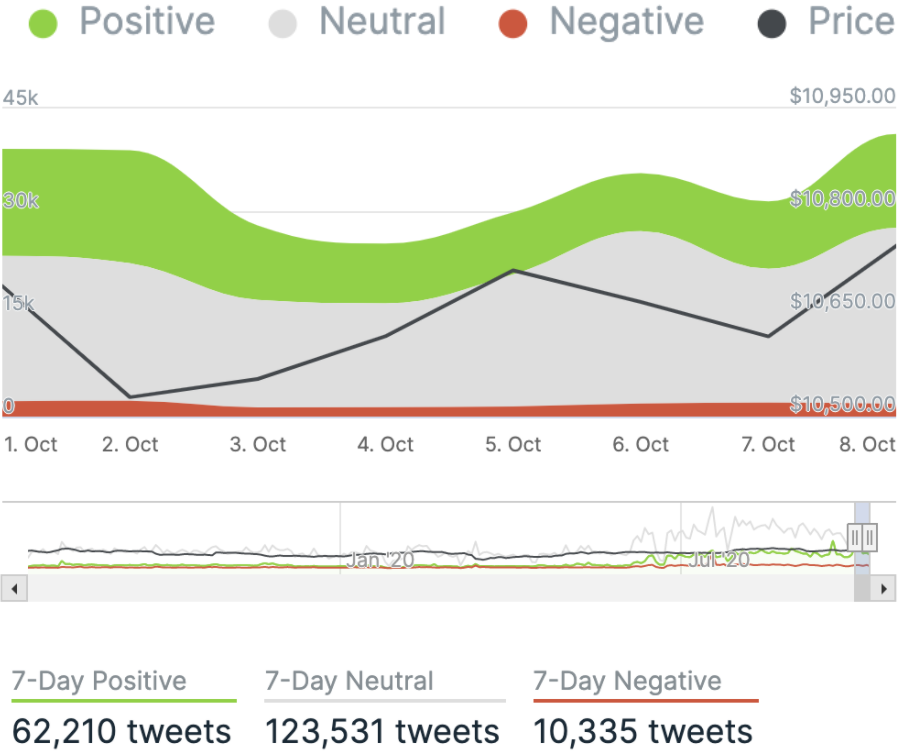
Chart provided by IntoTheBlock.com
Global In/Out of the money
For any address with a balance of tokens, ITB identifies the average price (cost) at which those tokens were purchased and compares it with the current price. If the current price is higher than average cost, address is ‘In the Money’. If the current price is lower than the average cost, the address is ‘Out of the Money’.
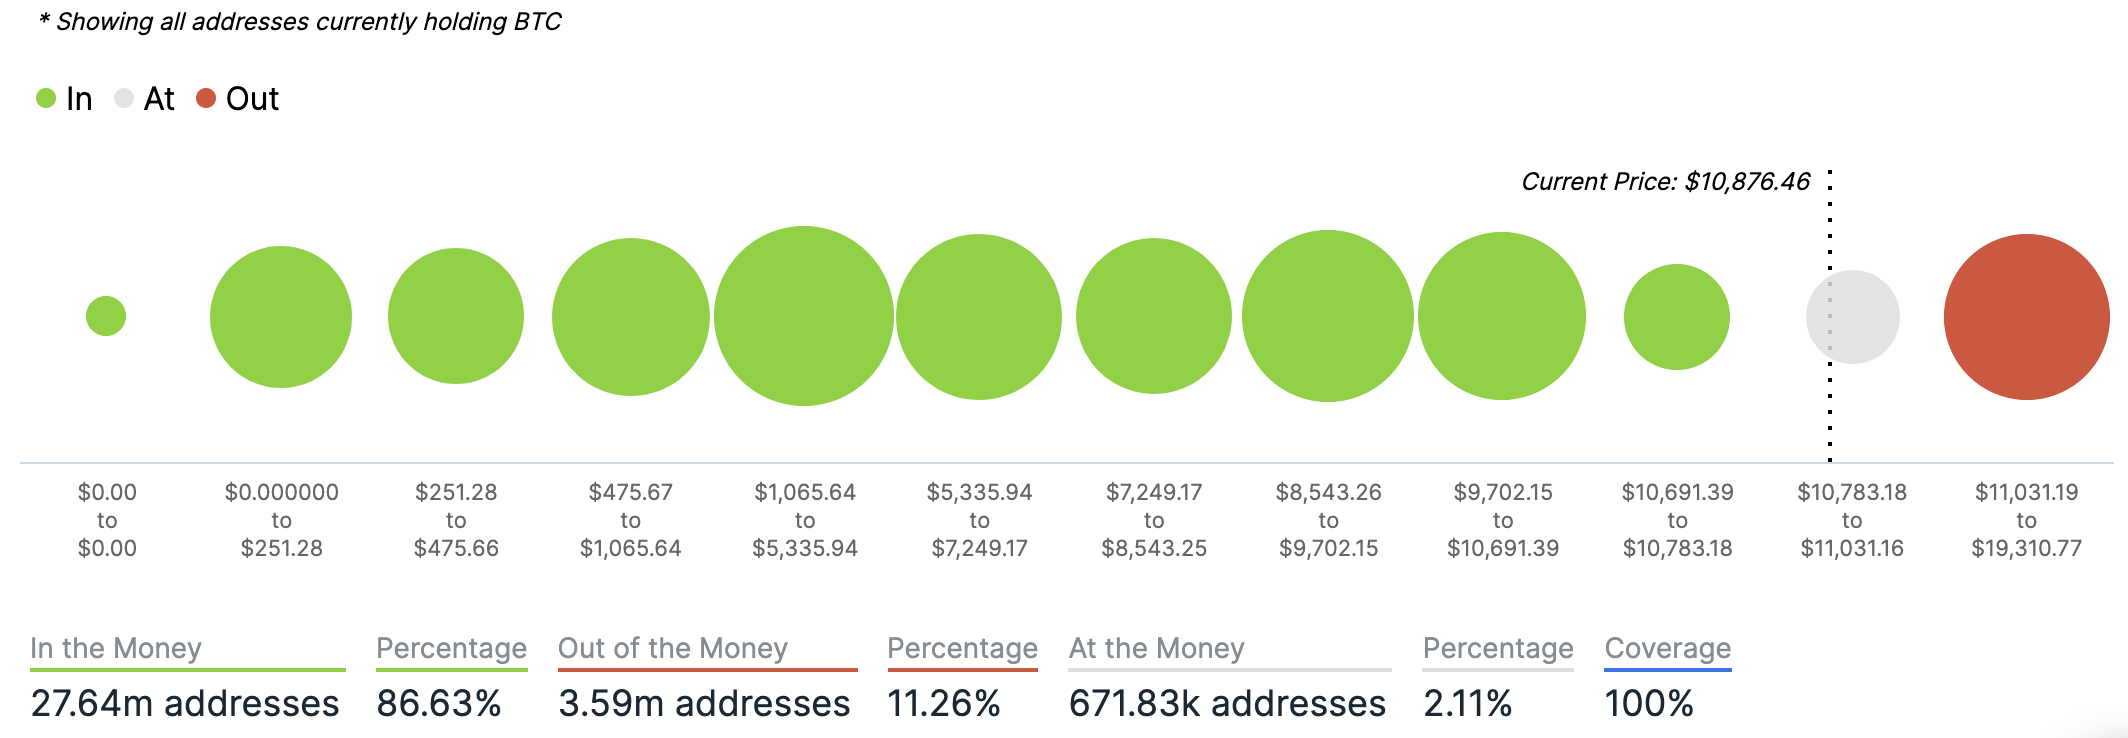
Chart provided by IntoTheBlock.com
Volatility
Annualised price volatility using 365 days.
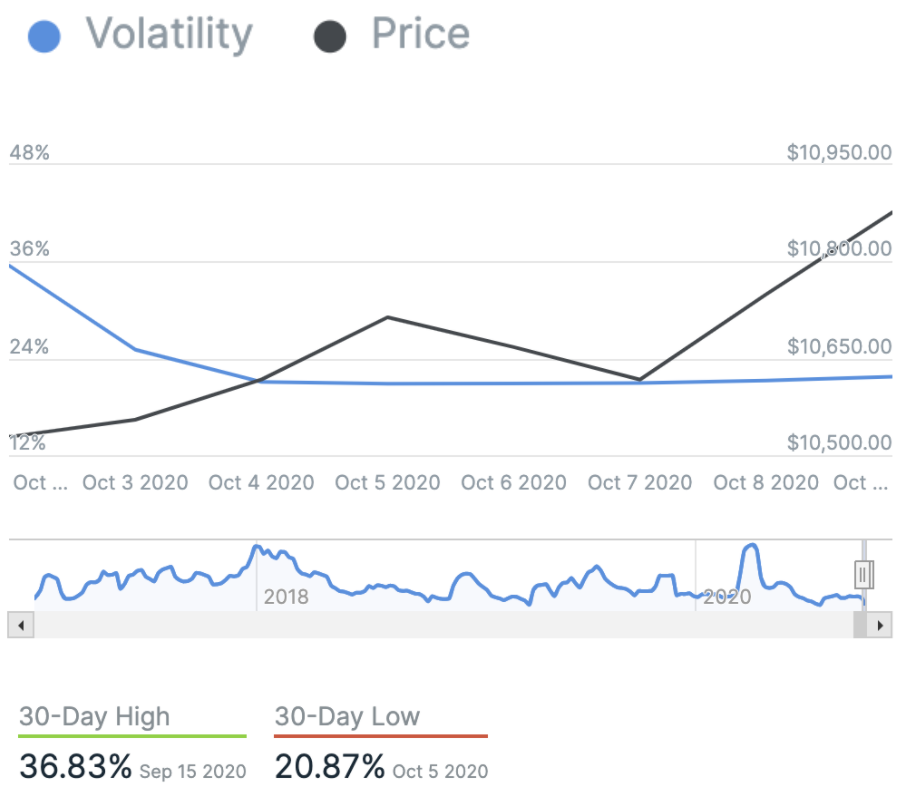
Chart provided by IntoTheBlock.com
Bitcoin’s market dominance
Bitcoin’s market dominance stands at 60.01. Its lowest recorded dominance was 37.09 on 8 January, 2018.
Relative Strength Index (RSI)
The daily RSI is currently 53.57. Values of 70 or above indicate that an asset is becoming overbought and may be primed for a trend reversal or experience correction in price – an RSI reading of 30 or below indicates an oversold or undervalued condition.
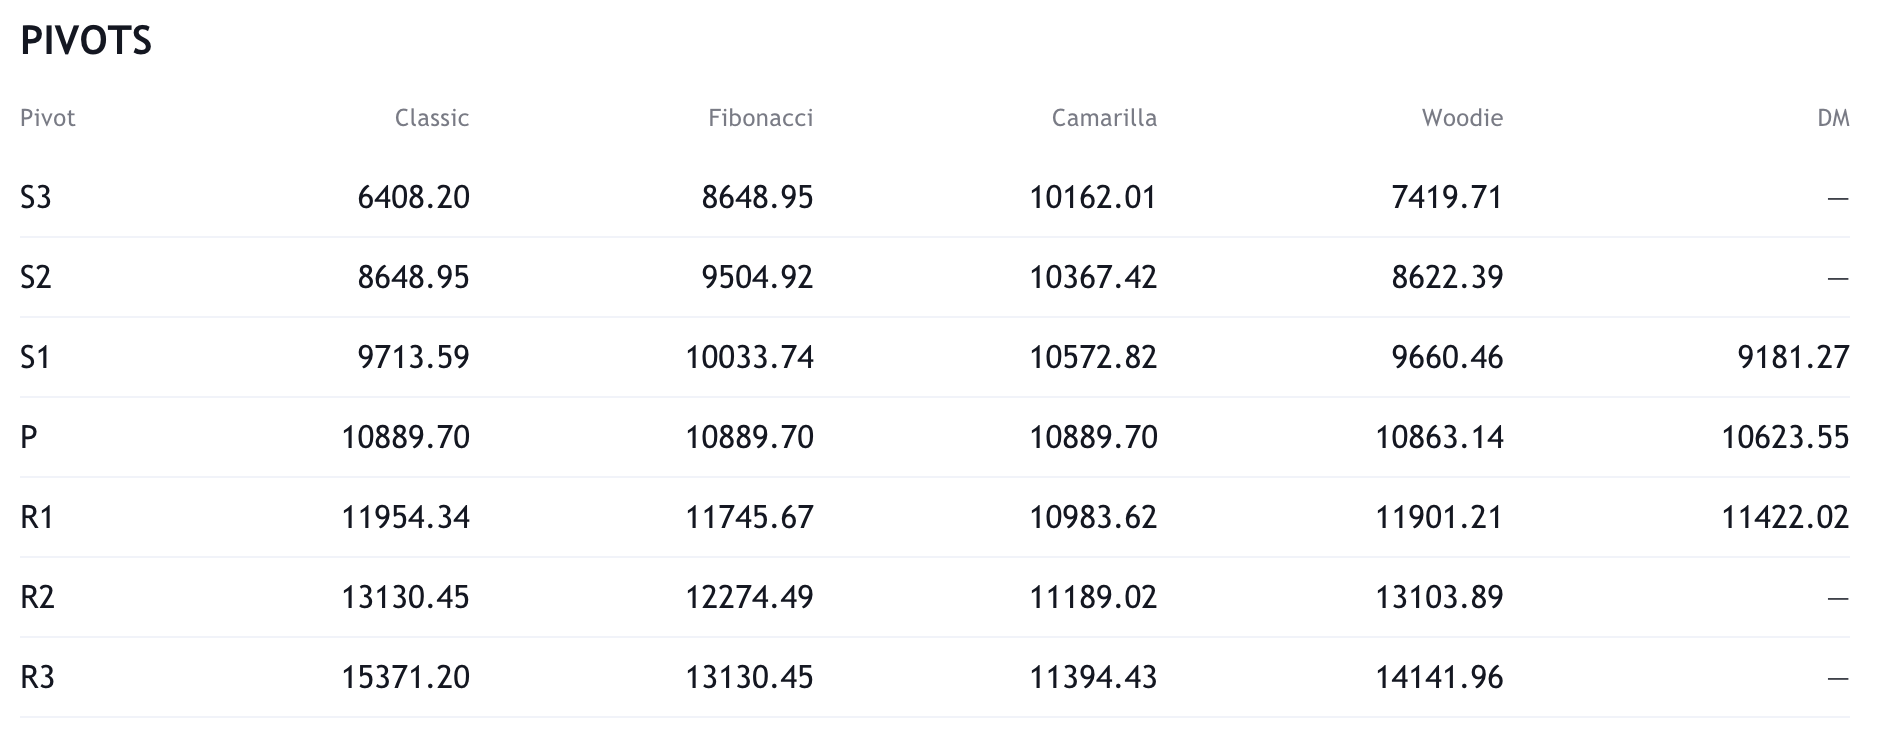
Resistance and support
What they said yesterday…
Today, @Square announced that it has purchased $50M in bitcoin. Square believes cryptocurrency is an instrument of economic empowerment and provides a way to participate in a global monetary system, which aligns with the company’s purpose. For more, visit https://t.co/HPhSMfVgac.
— Square IR (@SquareIR) October 8, 2020
More important than Square investing $50mm in #Bitcoin is sharing how we did it (so others can do the same): https://t.co/35ABYHuz4f
— jack (@jack) October 8, 2020
Square buys $50 million in bitcoin, says cryptocurrency ‘aligns with company’s purpose’ https://t.co/ojnK0vinzZ
— CNBC (@CNBC) October 8, 2020
Reminder, there will only ever be 21 million bitcoin
— Barry Silbert (@barrysilbert) October 8, 2020
What other data points would you like to see covered in our Daily Report? Let us know on Twitter.
Did you find this useful?