Discover
 Help Centre
 Status
 Company
 Careers
 Press
PressDaily market update: Stock market falls but bitcoin stays flat

If you’re new to the world of crypto trading and want to make sense of all these indicators, check out our beginner’s guide to crypto trading series, featuring in-depth explorations of common strategies, market analysis techniques, and more.
The content of this article is for information purposes only and is not investment advice or any form of recommendation or invitation. Luno always advises you to obtain your own independent financial advice before investing or trading in cryptocurrency.
All information is correct as of 08:30am BST.
Bitcoin price
We closed yesterday, 25 October, 2020, at a price of $13,075.25 with a daily high of $13,225.30 and a low of $12,822.38. That’s three consecutive daily closes over $13,000 and 92 consecutive daily closes over $10,000.
We’re 34.91% below bitcoin‘s all-time high of $20,089 (17 December 2017).
As of today, buying bitcoin has been profitable for…
98.1% of all days since 2013-04-28.
Bitcoin volume
The volume traded yesterday was $29,461,458,313 – up from $24,406,920,575 the day before. That’s the highest daily trading volume since 11 September. High volume indicates that a significant price movement has stronger support and is more likely to be sustained.
Market capitalisation
Bitcoin’s market capitalisation as of yesterday was $242,250,997,936, up from $241,425,217,440 the day before.
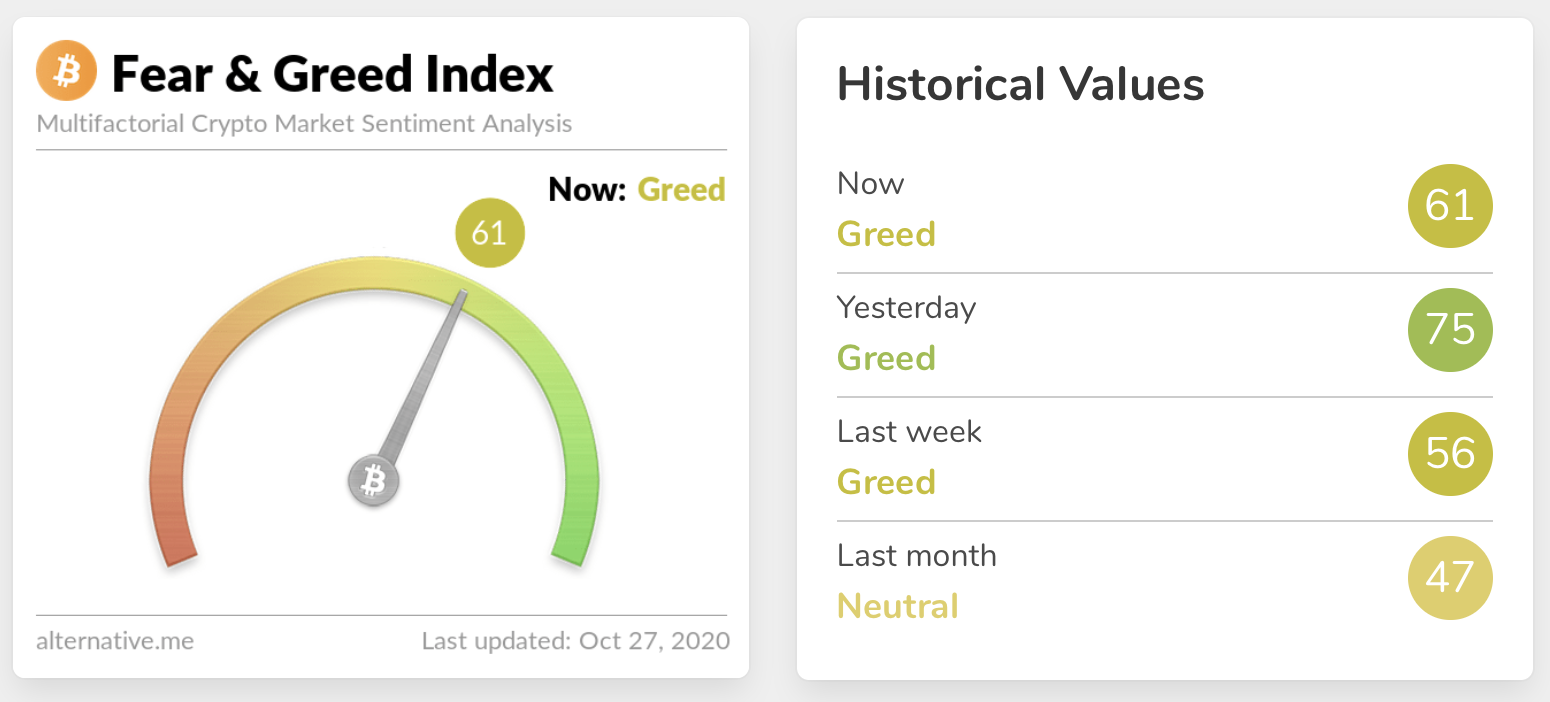
Fear and Greed Index
We’re still in the green, though there was a sharp drop from 75 yesterday to 61 today. This isn’t necessarily a bad thing – while extreme fear can indicate that investors are too worried, when investors are getting too greedy that means the market may be due for a correction.
Global In/Out of the money
For any address with a balance of tokens, ITB identifies the average price (cost) at which those tokens were purchased and compares it with the current price. If the current price is higher than average cost, address is ‘In the Money’. If the current price is lower than the average cost, the address is ‘Out of the Money’.
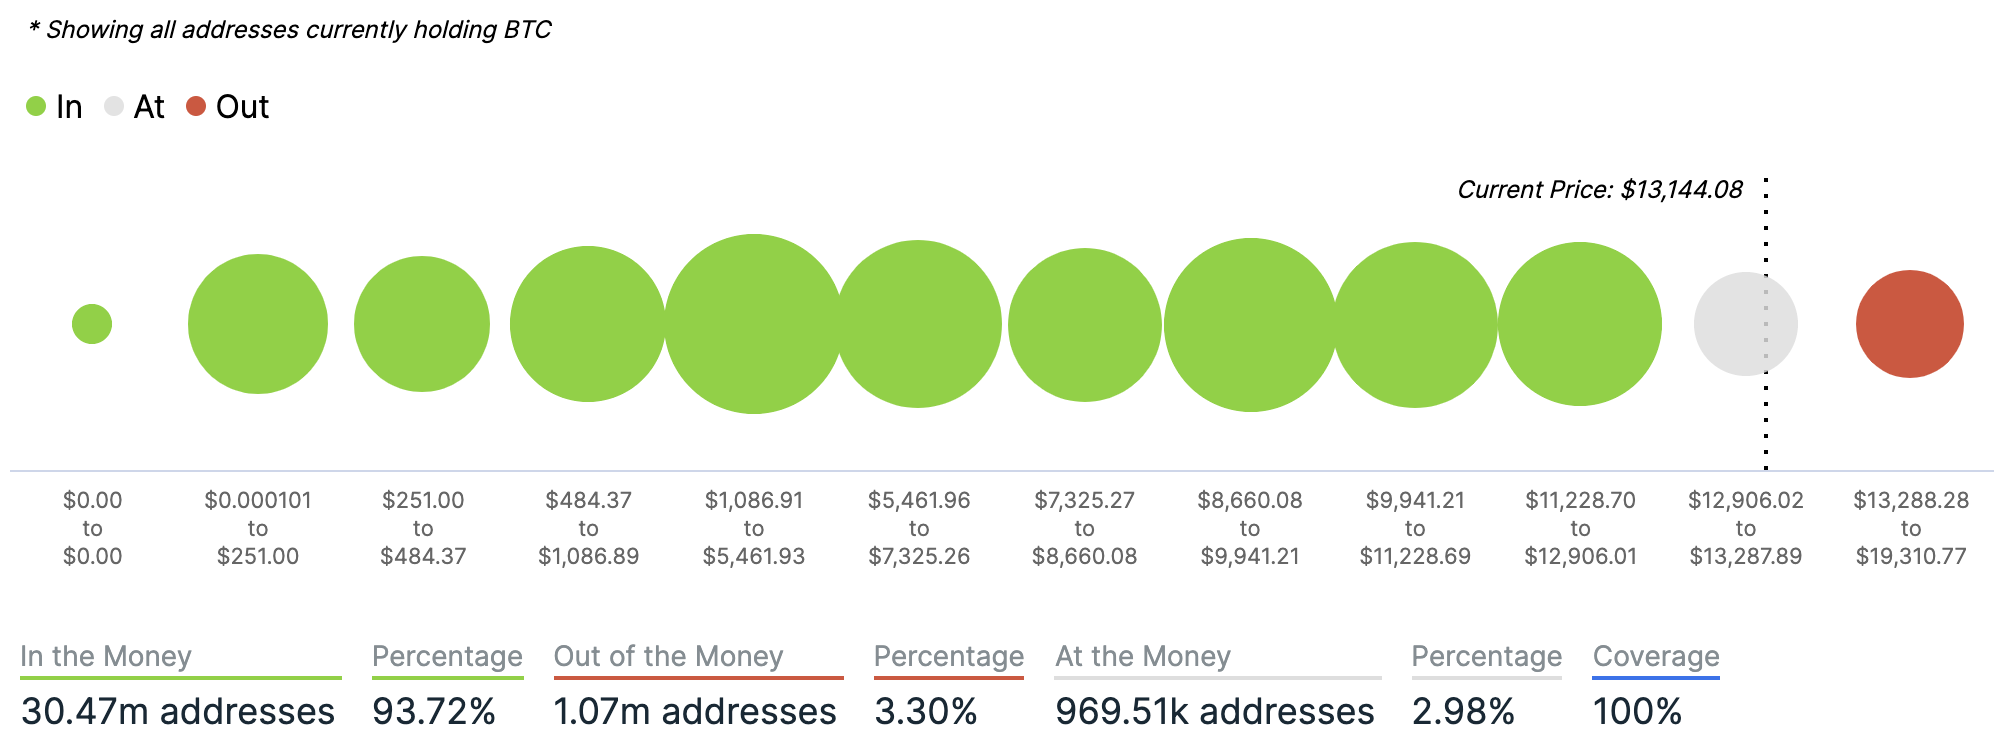
Chart provided by IntoTheBlock.com
Volatility
Annualised price volatility using 365 days.
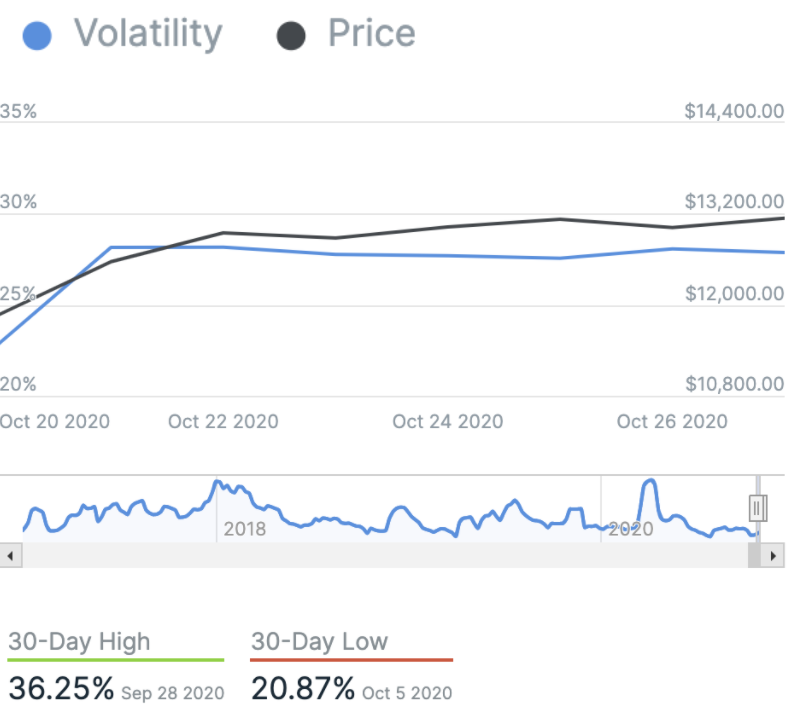
Chart provided by IntoTheBlock.com
Bitcoin’s market dominance
Bitcoin’s market dominance stands at 64.42. Its lowest recorded dominance was 37.09 on 8 January, 2018.
Relative Strength Index (RSI)
The daily RSI is currently 79.53. Values of 70 or above indicate that an asset is becoming overbought and may be primed for a trend reversal or experience correction in price – an RSI reading of 30 or below indicates an oversold or undervalued condition.
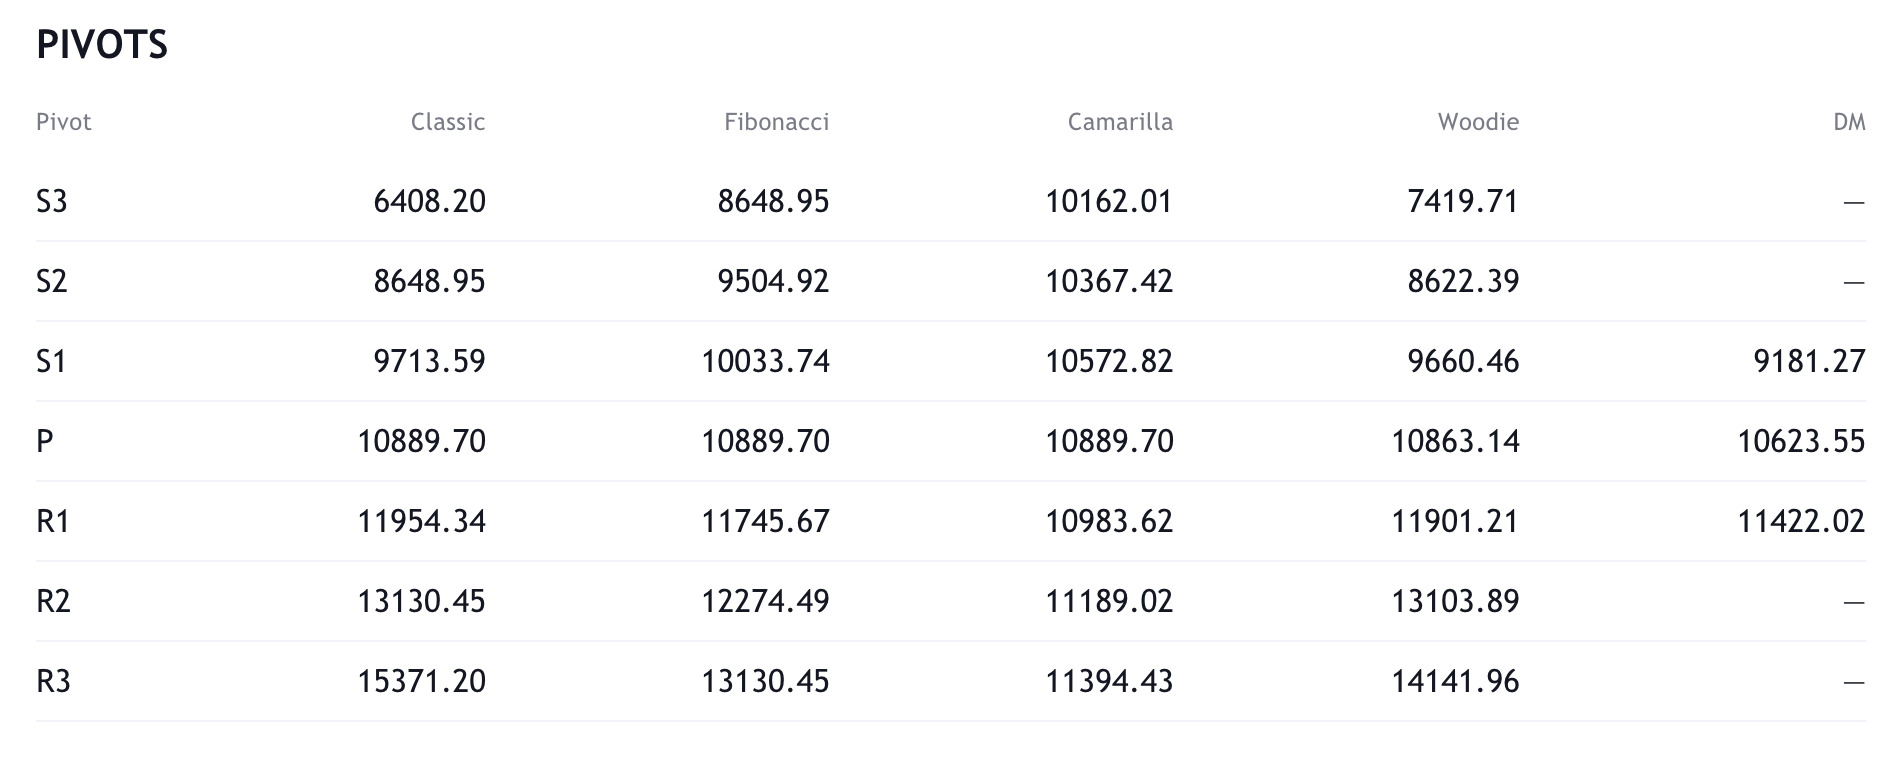
Resistance and support
What they said yesterday…
Stocks took a dive today. #Bitcoin is flat. The decoupling is upon us. https://t.co/iR5UEPUtkR
— Cameron Winklevoss (@cameron) October 27, 2020
We’re on the cusp of an event of great consequence…
An all-time high on the monthly close of #Bitcoin.
— Jimmy Song (송재준) (@jimmysong) October 27, 2020
For years J.P. Morgan was skeptical of Bitcoin. Now the bank’s analysts say its value could triple, challenge gold @FortuneMagazine @jeffjohnroberts https://t.co/oa45zgbltM
— Barry Silbert (@BarrySilbert) October 26, 2020
What other data points would you like to see covered in our Daily Report? Let us know on Twitter.
Did you find this useful?