Luno’s market analysis – Week 25

Welcome to this week’s retrospective of the latest goings-on in the crypto markets, featuring an overview of price movements, a look at the fundamentals, and the impact of other major events over the last week. The content of this article is for information purposes only and is not investment advice or any form of recommendation or invitation. Luno always advises you to obtain your own independent financial advice before investing or trading in cryptocurrency.
It was another relatively slow week in the crypto market, although we did see a small spike on Monday – possibly linked to rumours that payments giants PayPal and Venmo are planning to let users buy and sell crypto. Will this be the start of a bigger movement in the crypto market?
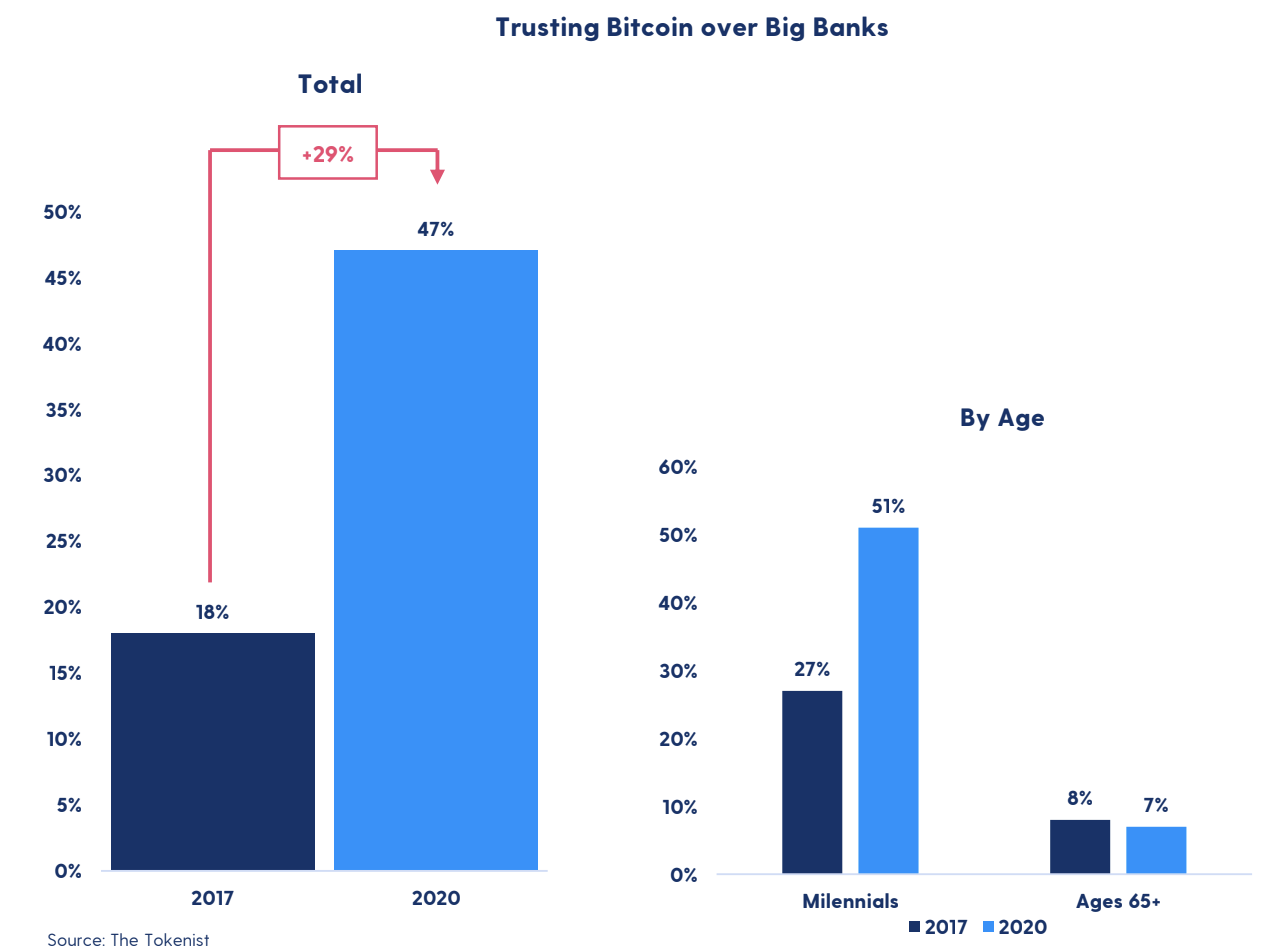
If the PayPal rumours are true, demand among younger users is likely among the main attractions. The Tokenist recently reported that trust in Bitcoin over big banks has risen sharply over the past 3 years – particularly among millennials. In a survey they conducted in 2017, 18% of respondents indicated that they trusted Bitcoin over banks. This has since risen by 29% – reaching 47% in the recent Tokenist survey. This rose to 51% among millennials questioned, up from 27% in 2017.
Price analysis
Short-term view
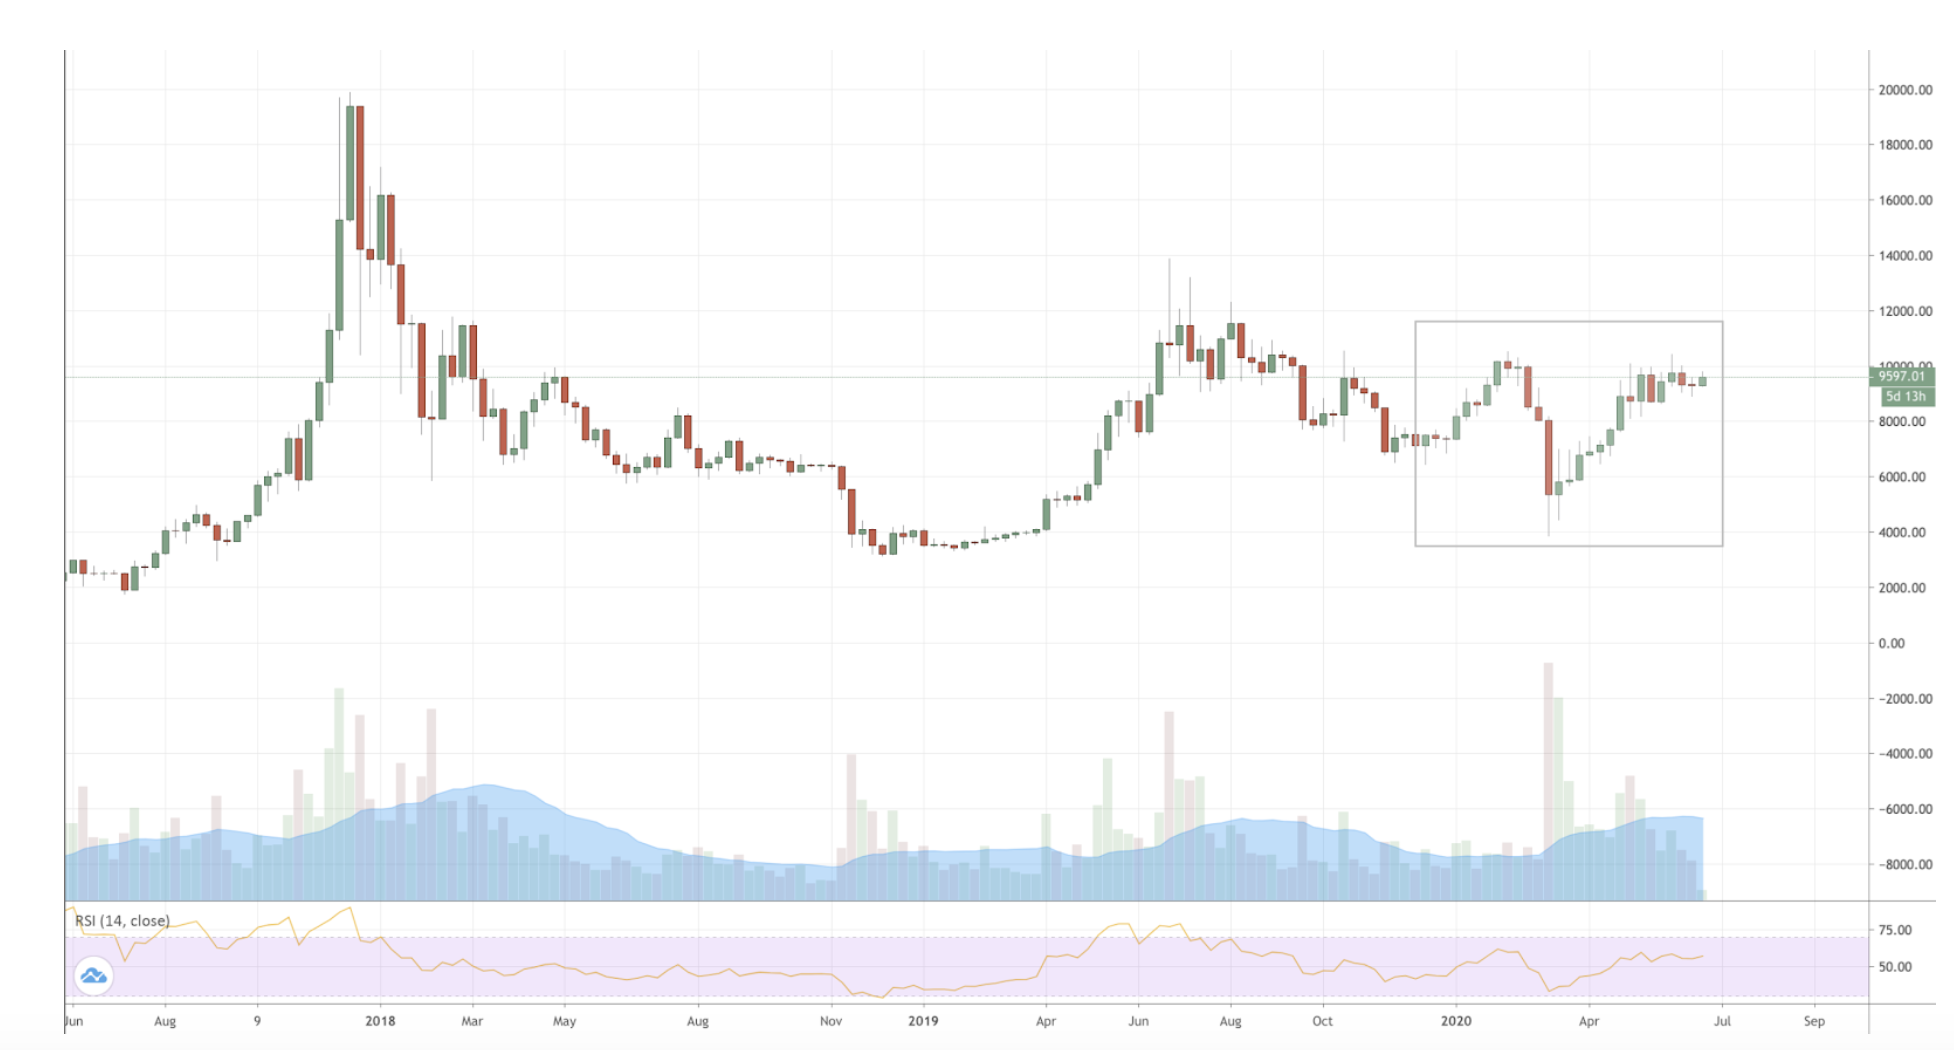
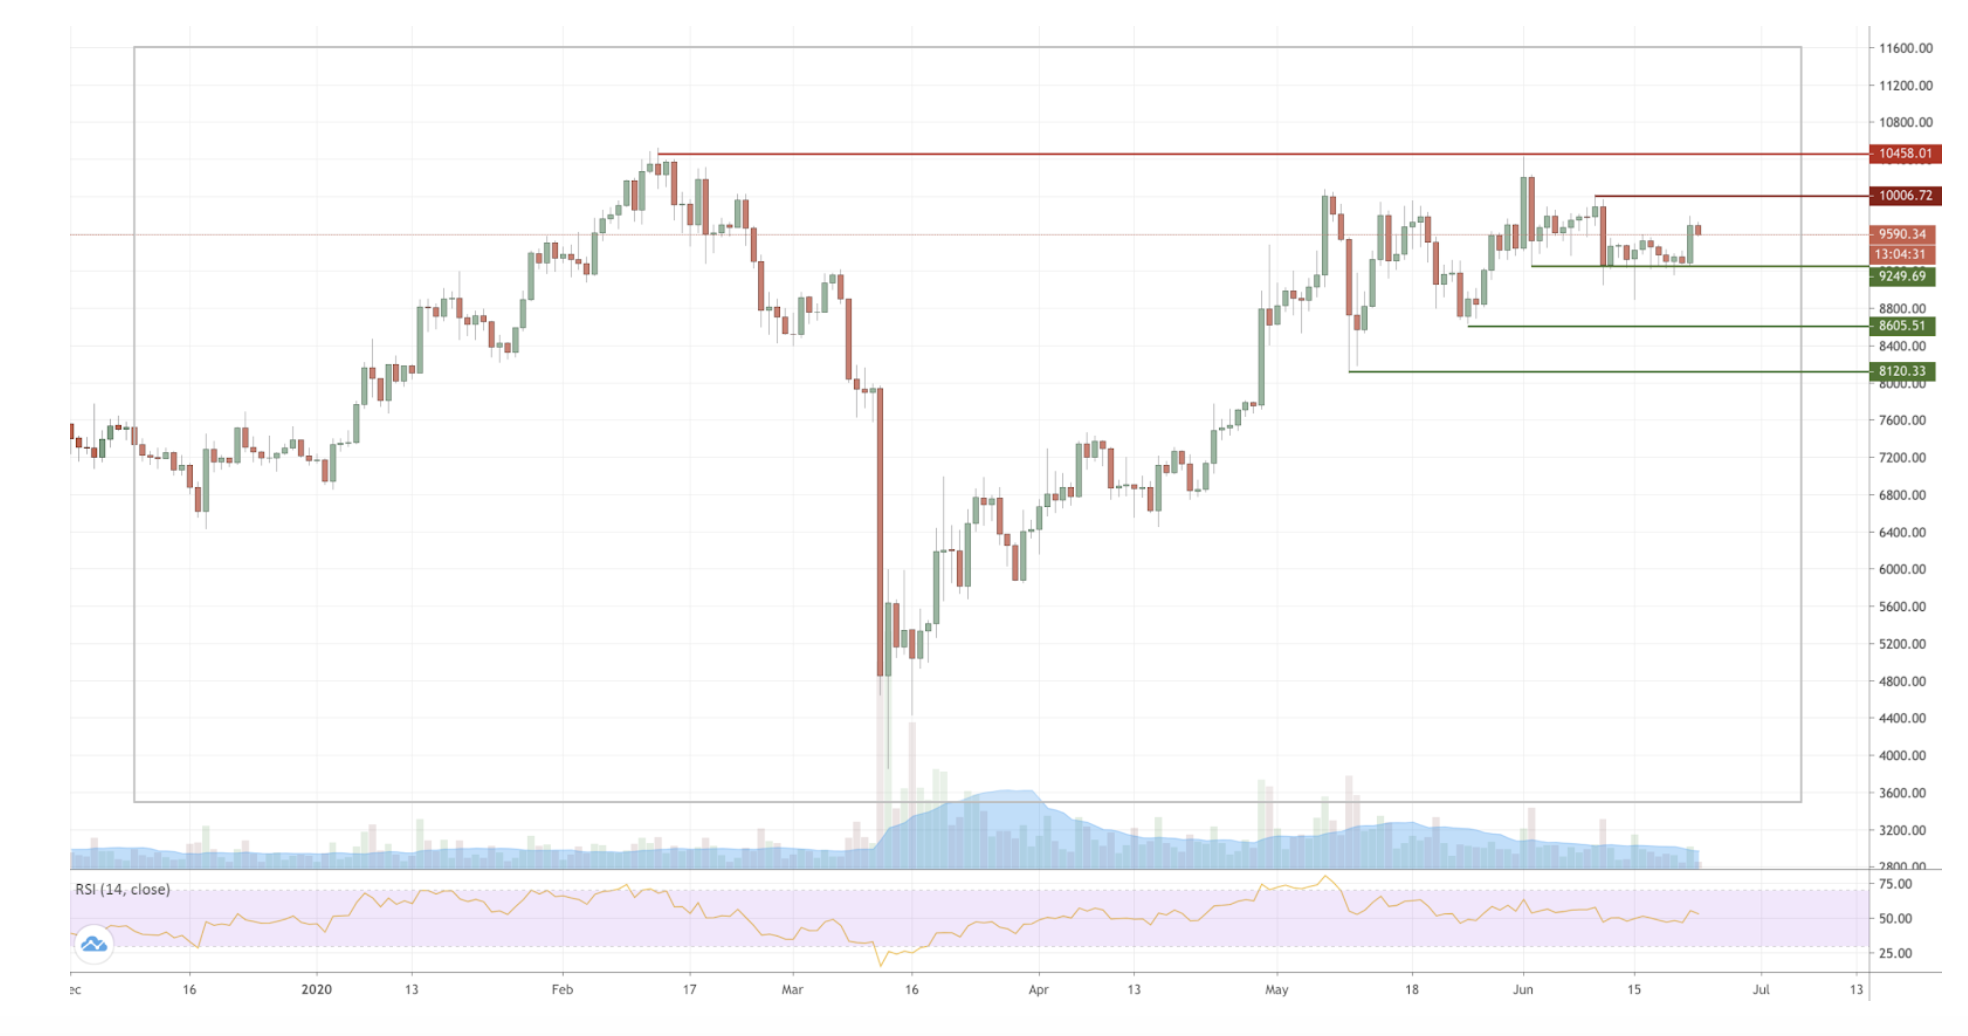
Nearly a month after rebounding from its yearly high of around $10,500, BTC has spent the last two weeks in relative limbo. After further downward movement from $10,000 to $9,200 on 11 June, BTC has been trading range-bound between the $9,200 and $9,500 mark, with low and declining trading volumes indicating a degree of uncertainty in the market over this time.
This Monday, however, seems to have brought a bit of spark back to crypto, with a breakout from a symmetrical triangle formed over the last 30 days pushing the price as high as $9,800. This breakout leads to a potential early support level being formed at the top of the previously mentioned range at $10,500 should BTC be able to hold its current momentum. However, while trading volumes increased during Monday’s price rise, they were still comparably low when contrasted with those seen over the course of May. This indicates that the majority of the market was not quite ready to get involved in this move as of yet.
Should BTC continue its upward trajectory, it will need to overcome both the psychological $10,000 barrier as well as its yearly high of $10,500. These are the levels to keep in mind when looking for resistance zones. However, should the price take a downturn, look for immediate support in the previously mentioned zone of $9,500 to $9,200.
Long-term view
We have now been ranging since the beginning of May, giving rise to speculation that we could see a big move in the crypto market soon. The low volumes remain a potential hindrance to any sustained breakout, but conditions certainly seem to indicate a big movement one way or another.
Reasons to be cheerful
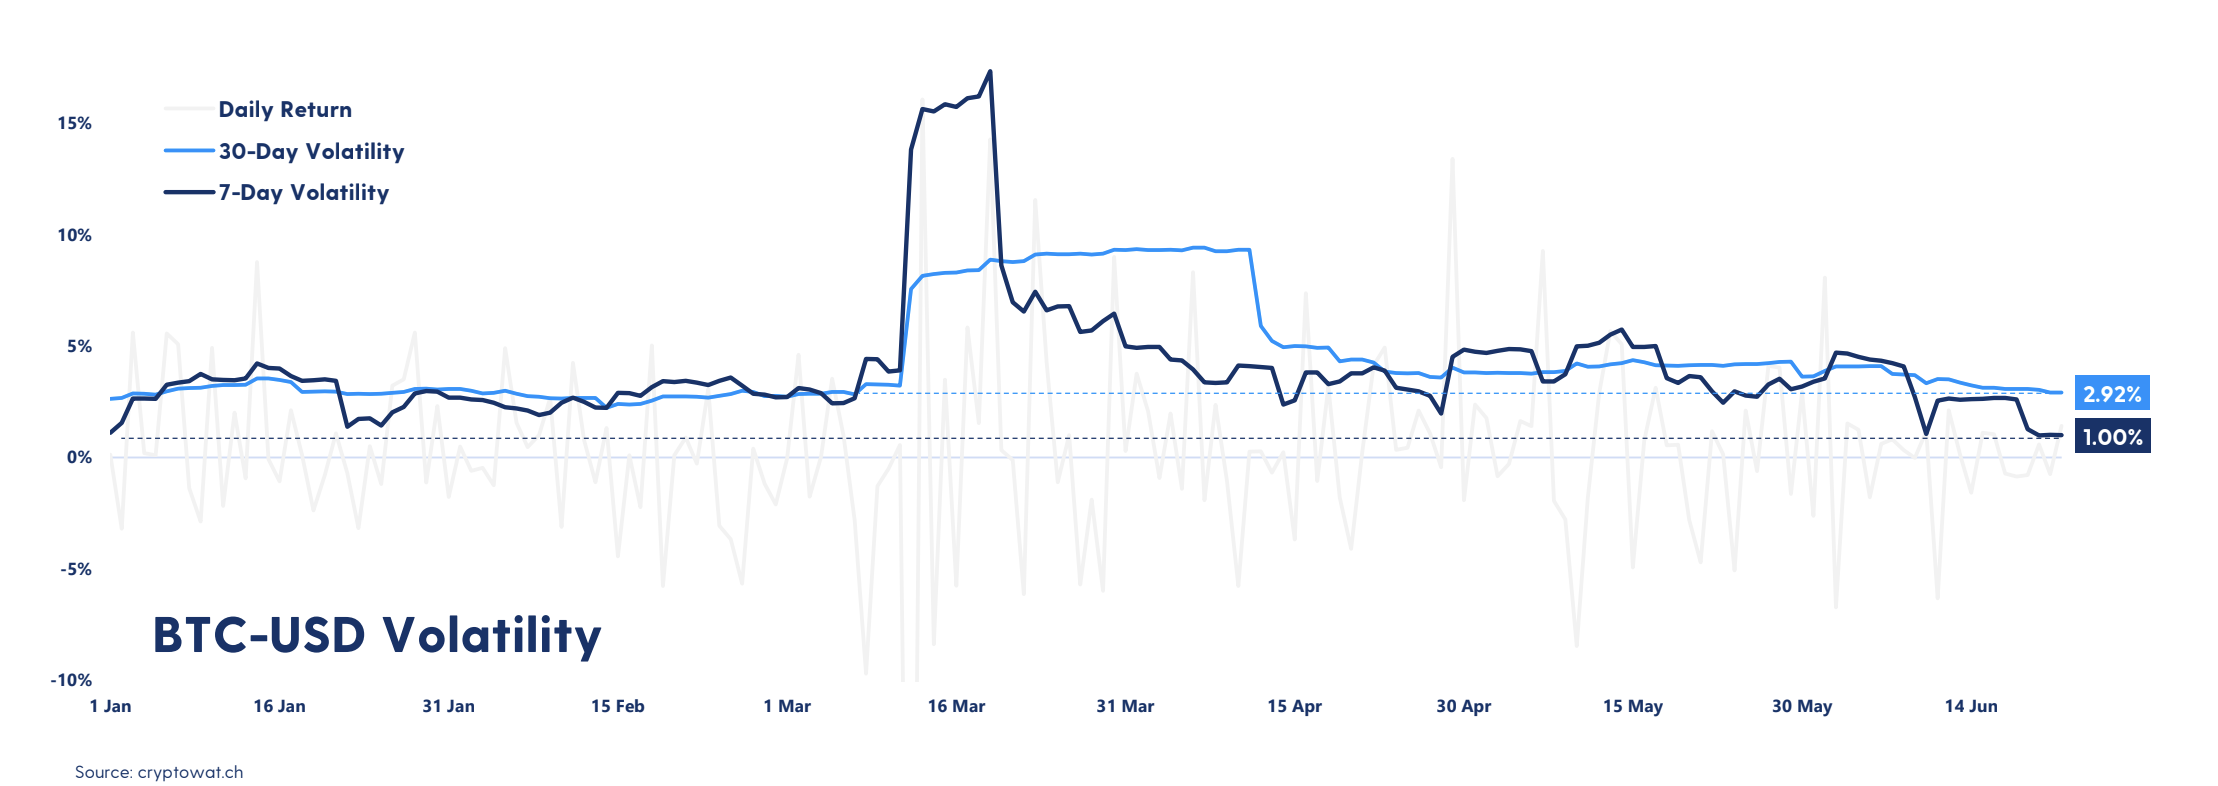
The 7-day volatility fell to its lowest level so far in 2020 last week and dropped even lower over the weekend.
Market sentiment unchanged
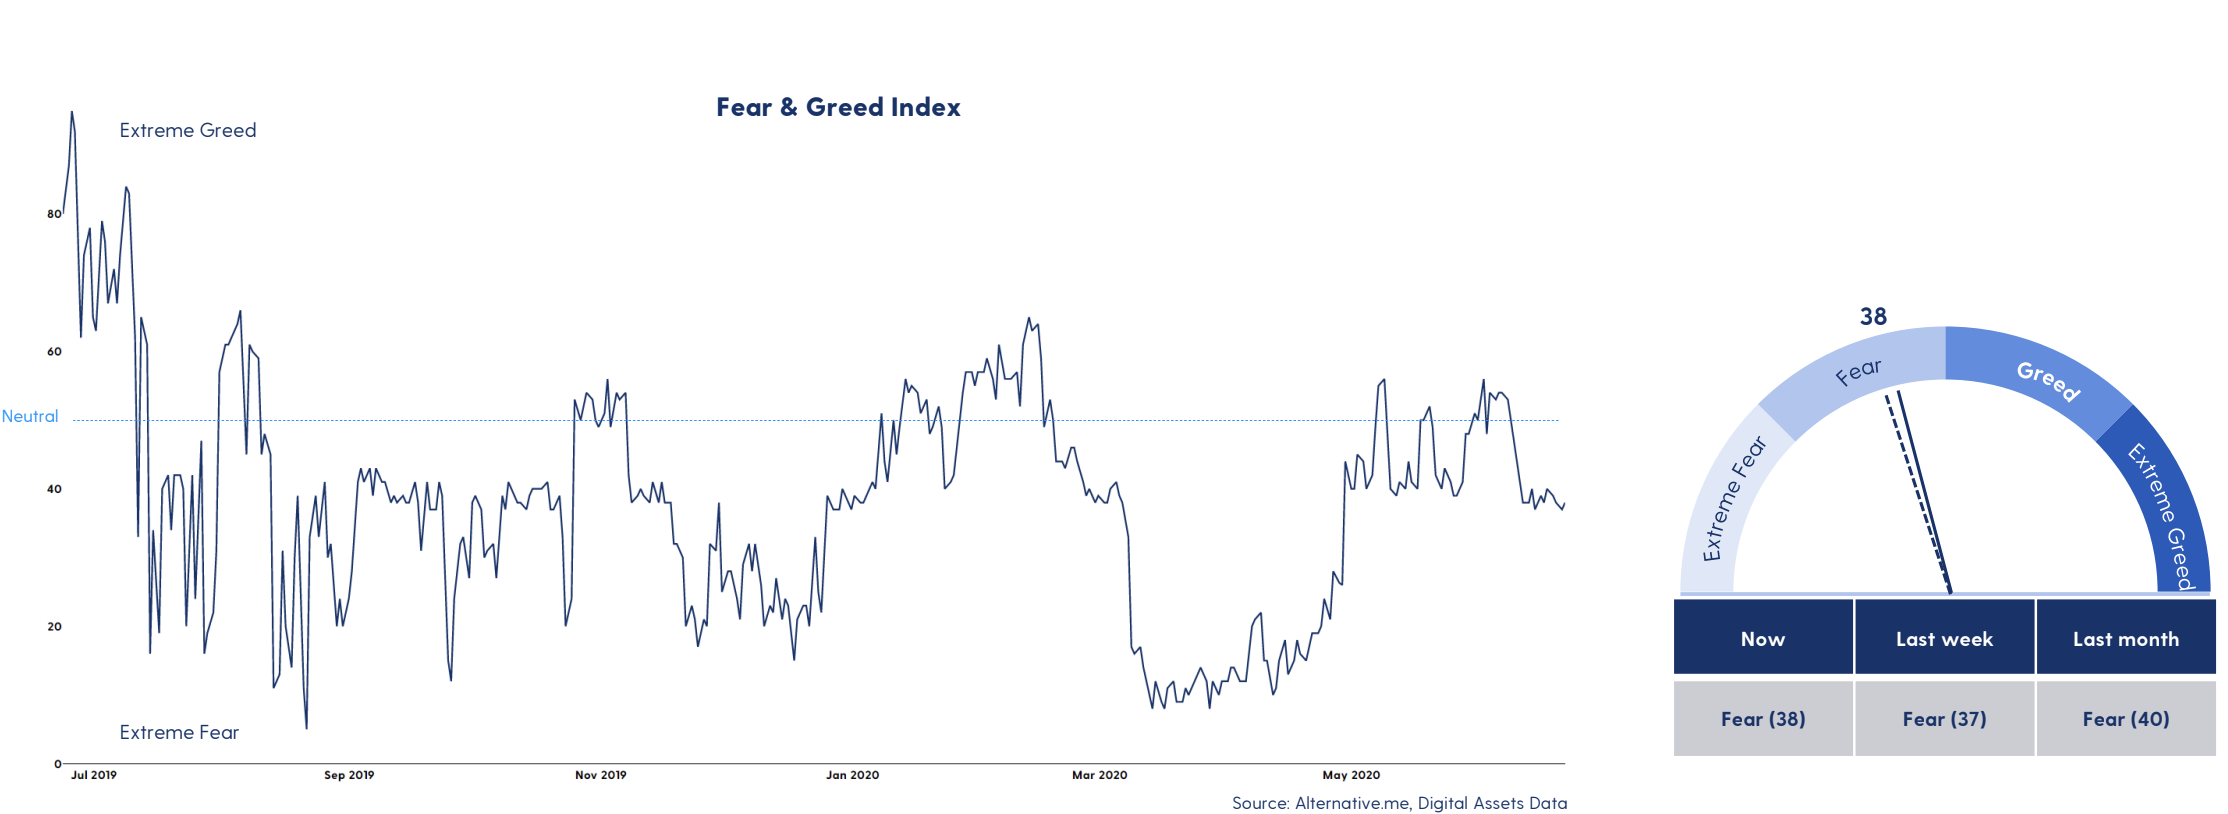
The Fear & Greed Index dropped back down into the “fear” zone last week and has been flat ever since. This is what usually happens when the BTC price is flat. The Index finished the week at 38 but moved up to 41 late last night and now holds fairly close to the “neutral” area.
Bitcoin volume moving sideways
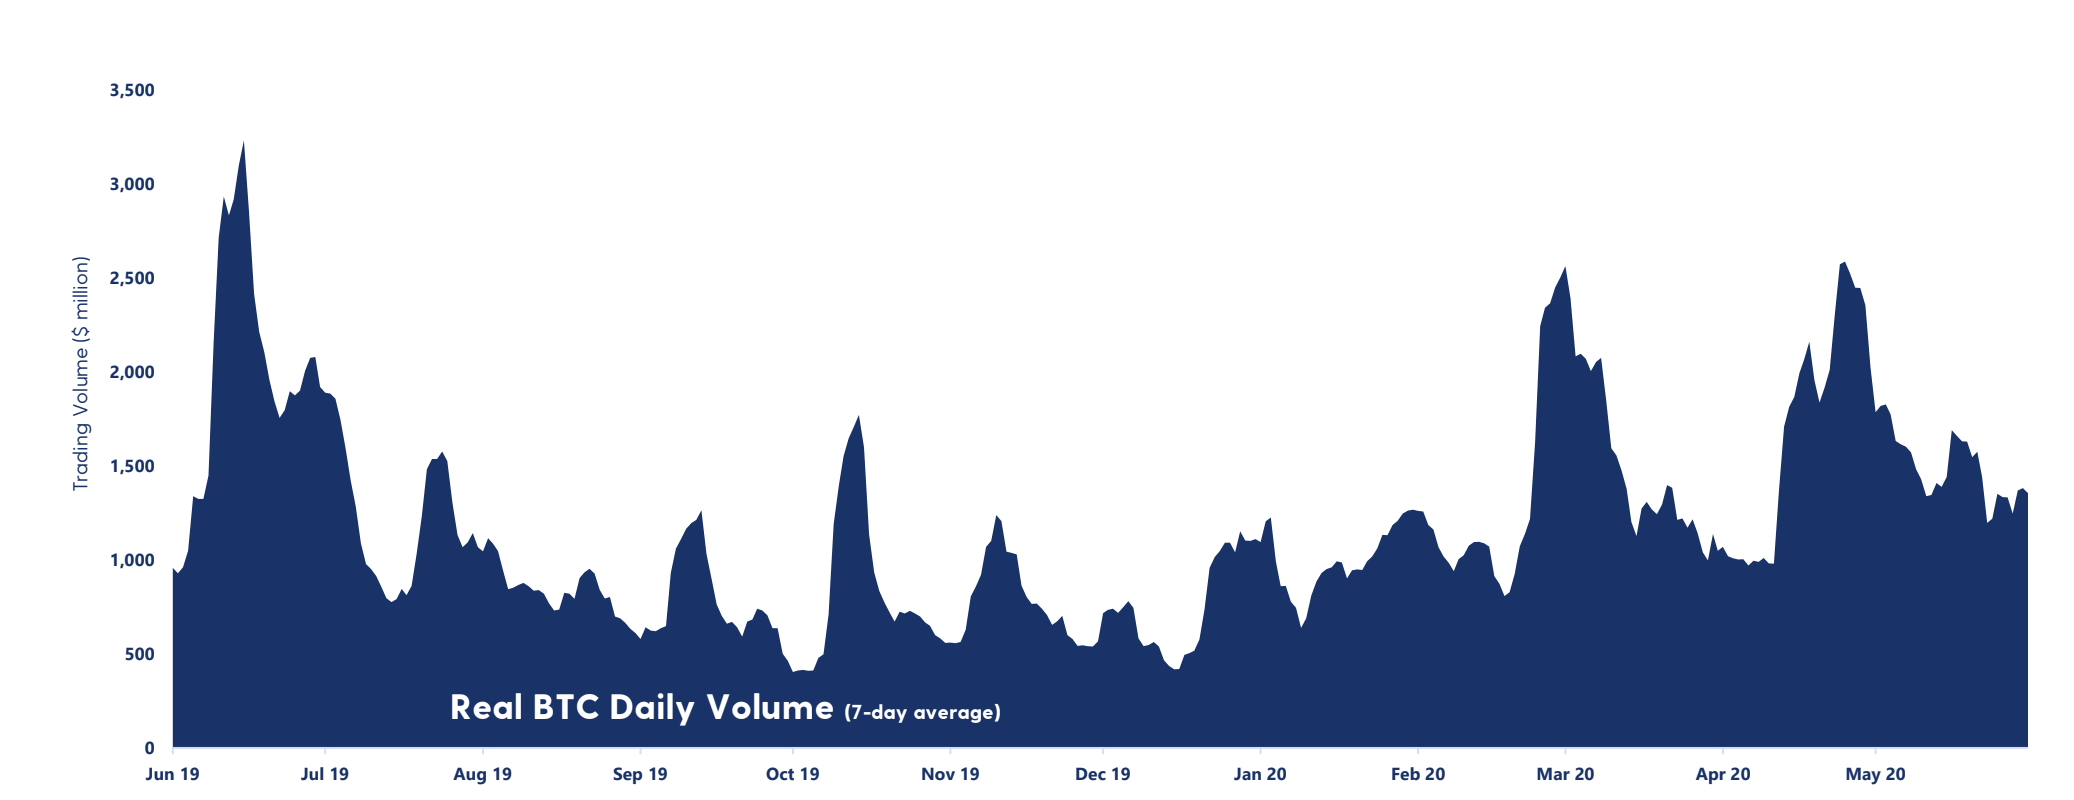
The 7-day average real trading volume has been trending downwards for a while but is now stabilising.
Mining difficulty jumps 15%
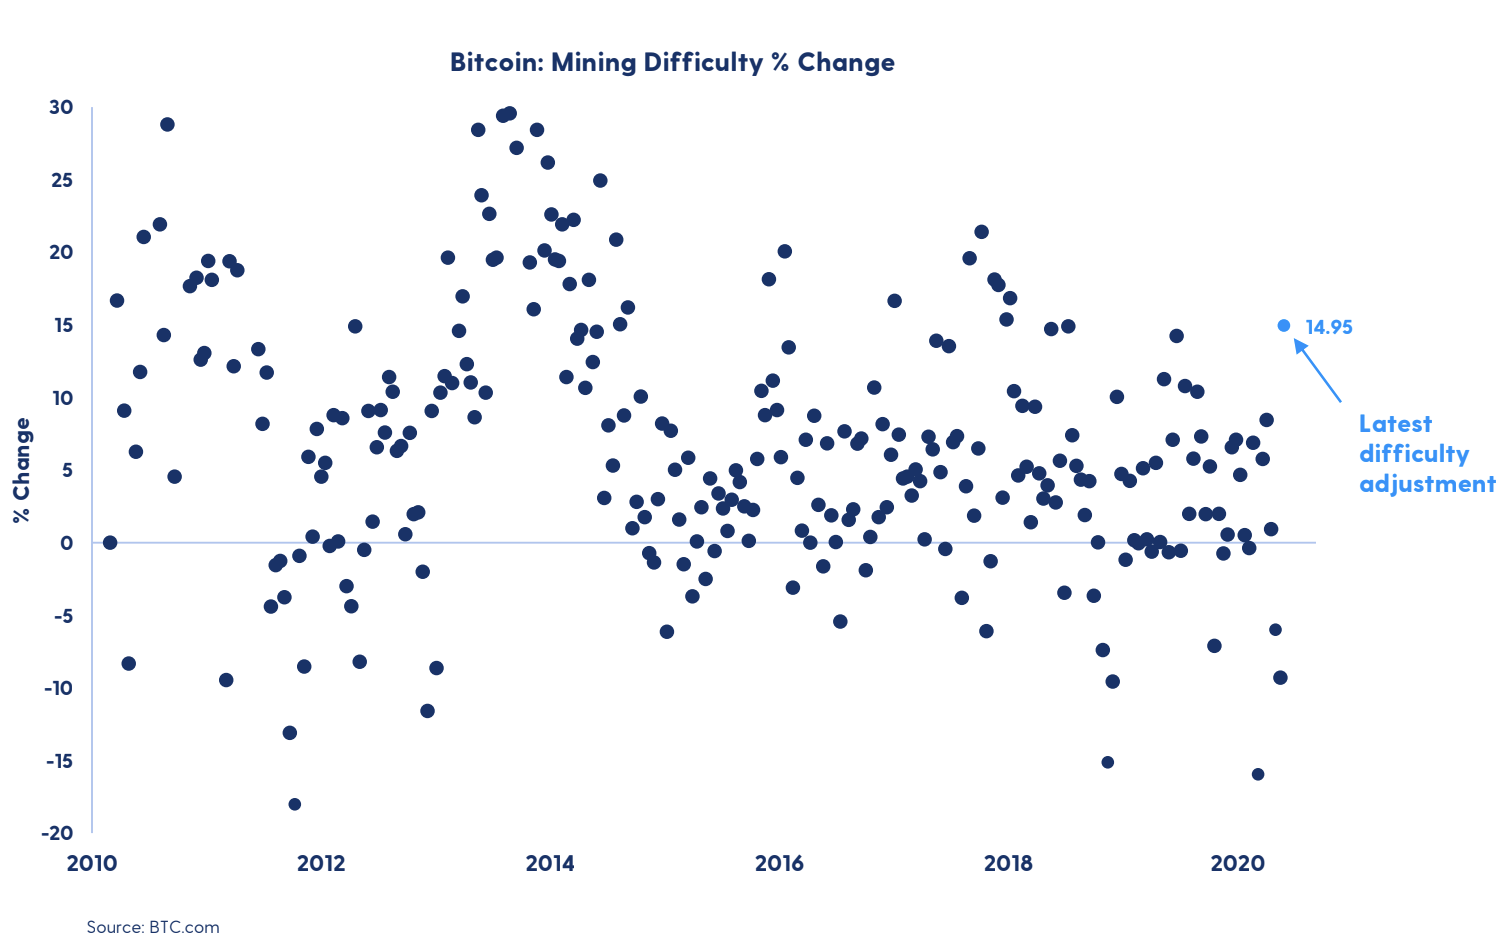
Last week, mining difficulty for Bitcoin increased by almost 15% – the largest positive change since January 2018. To ensure that the Bitcoin network continues to mine new blocks every 10th minute, the mining difficulty adjust every 2016 blocks (approx. every 2 weeks).
After two negative adjustments following the halving, more miners are once again competing to solve the puzzle to win the freshly minted Bitcoin. The period since the last difficult adjustment has seen an average block time of 8m 42s, as the hast rate has been increased. It is now back to pre-halving levels as highlighted last week. Bitcoin’s largest jump in mining difficulty happened on Oct 14, 2013, when it increased 29.56%.
The Bitcoin on-chain demand looks weak
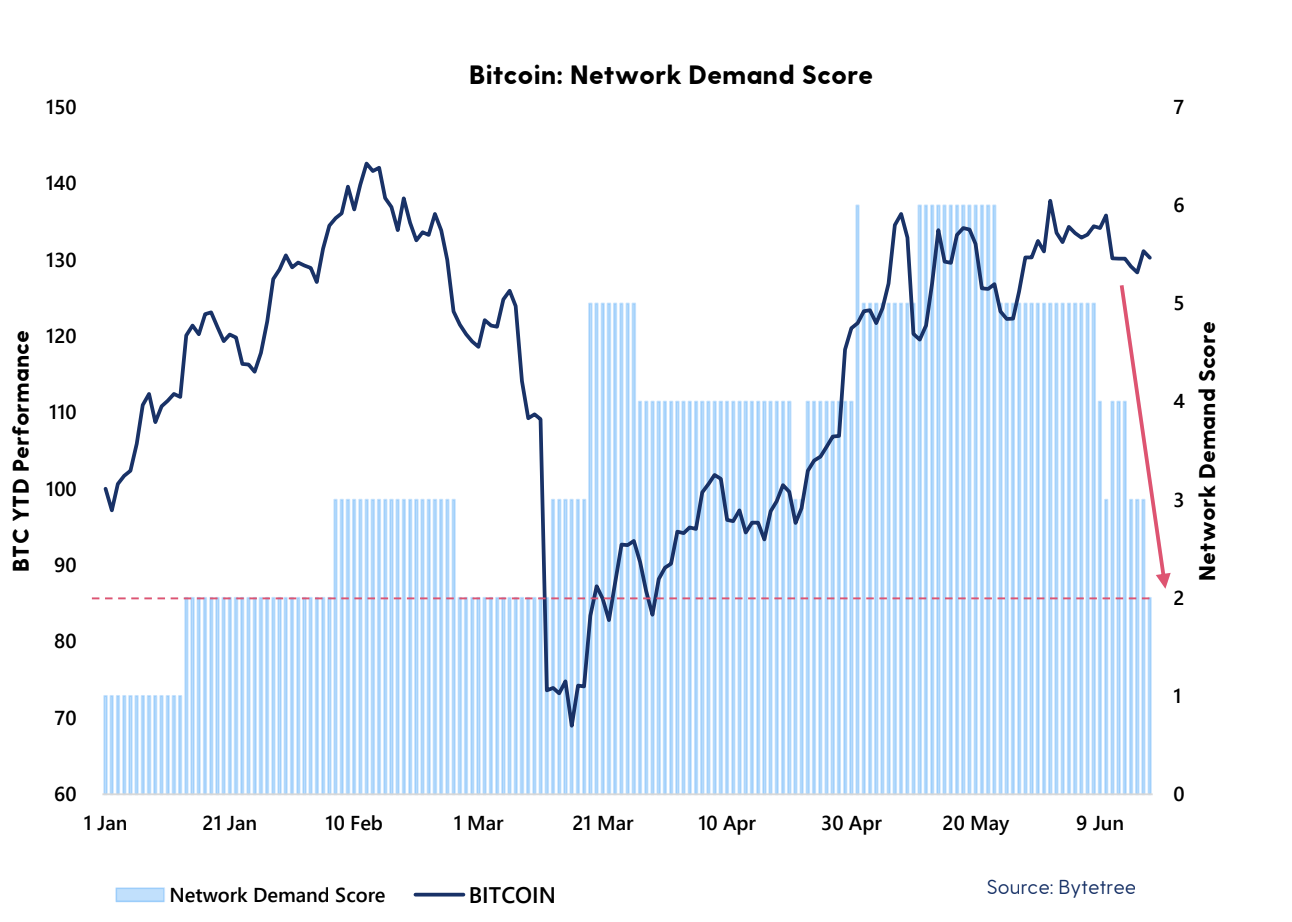
We’re revisiting the Network Demand Score again this week, a metric developed by Bytetree. This on-chain demand metric incorporates network velocity, transaction value ($), fees ($) and Miner’s Rolling Inventory. Growing demand is measured as a 4,5 or 6. Weaker demand 0,1 or 2. A score of 3/6 suggests demand is in an inflection point.
Network demand falls to a 2/6 this week with weakening demand across the board, the lowest level since early March before the market crashed. MRI, velocity, short-term spend and short-term fees look weak. Notably, velocity has been trending down since mid- May, indicating a slowdown in transaction activity on the Bitcoin network. This favours more downside for Bitcoin.
 Discover
 Help Centre
 Status
 Company
 Careers
 Press
Press

