Discover
 Help Centre
 Status
 Company
 Careers
 Press
PressDaily market update: “Bitcoin and blockchain are the ‘future’ of Twitter, CEO Jack Dorsey reveals”

With the first of the US presidential debates out the way, we’re looking at an interesting few months in the crypto markets. There’s the continued uncertainty surrounding COVID-19, the US presidential elections, and Brexit all set to impact the markets in as-yet unknown ways. What’s next?
Here’s today’s look at the metrics. If you’re new to the world of crypto trading, don’t forget to take a look through our beginner’s guide to crypto trading series, featuring in-depth explorations of common strategies, market analysis techniques, and more.
The content of this article is for information purposes only and is not investment advice or any form of recommendation or invitation. Luno always advises you to obtain your own independent financial advice before investing or trading in cryptocurrency.
All information is correct as of 09:45am BST.
Bitcoin price
We closed yesterday, 29 September, 2020, at a price of $10,848.83 – with a daily high of $10,858.94 and a low of $10,665.34.
That’s the highest closing price since 20 September, when it was $10,814.48. On the 29 September, 2019, the closing price was $8,104.19.
We’re 46.00% below bitcoin‘s all-time high of $20,089 (17 December 2017).
As of today, buying bitcoin has been profitable for…
93.8% of all days since 2013-04-28.
Bitcoin volume
The volume traded yesterday was $20,459,870,042 – down from $22,720,365,389 the day before.
Market capitalisation
Bitcoin’s market capitalisation as of yesterday was $200,742,343,863, up from $198,373,626,496 the day before. To put that into context, Jeff Bezos is currently worth $175.3 billion. This means he can only afford to buy 87.33% of all bitcoin. Better start saving, Jeff.
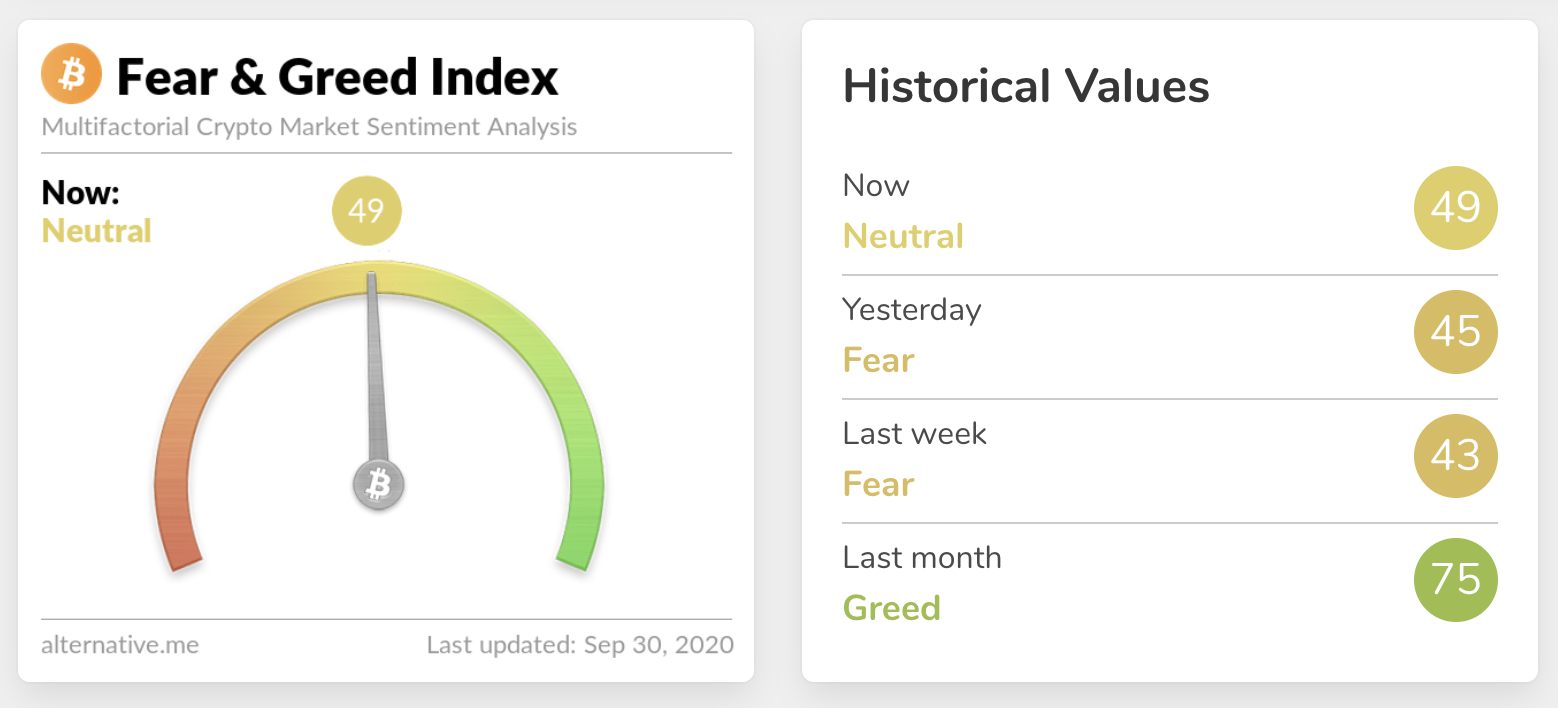
Fear and Greed Index
Sentiment is back down in the Neutral zone at 49, up from 45 yesterday. This is the highest we’ve been since 20 September. Extreme fear can be a sign that investors are too worried, which could be a buying opportunity. When Investors are getting too greedy, that means the market may be due for a correction. Are we set for a big move?
Global In/Out of the money
For any address with a balance of tokens, ITB identifies the average price (cost) at which those tokens were purchased and compares it with the current price. If the current price is higher than average cost, address is ‘In the Money’. If the current price is lower than the average cost, the address is ‘Out of the Money’.
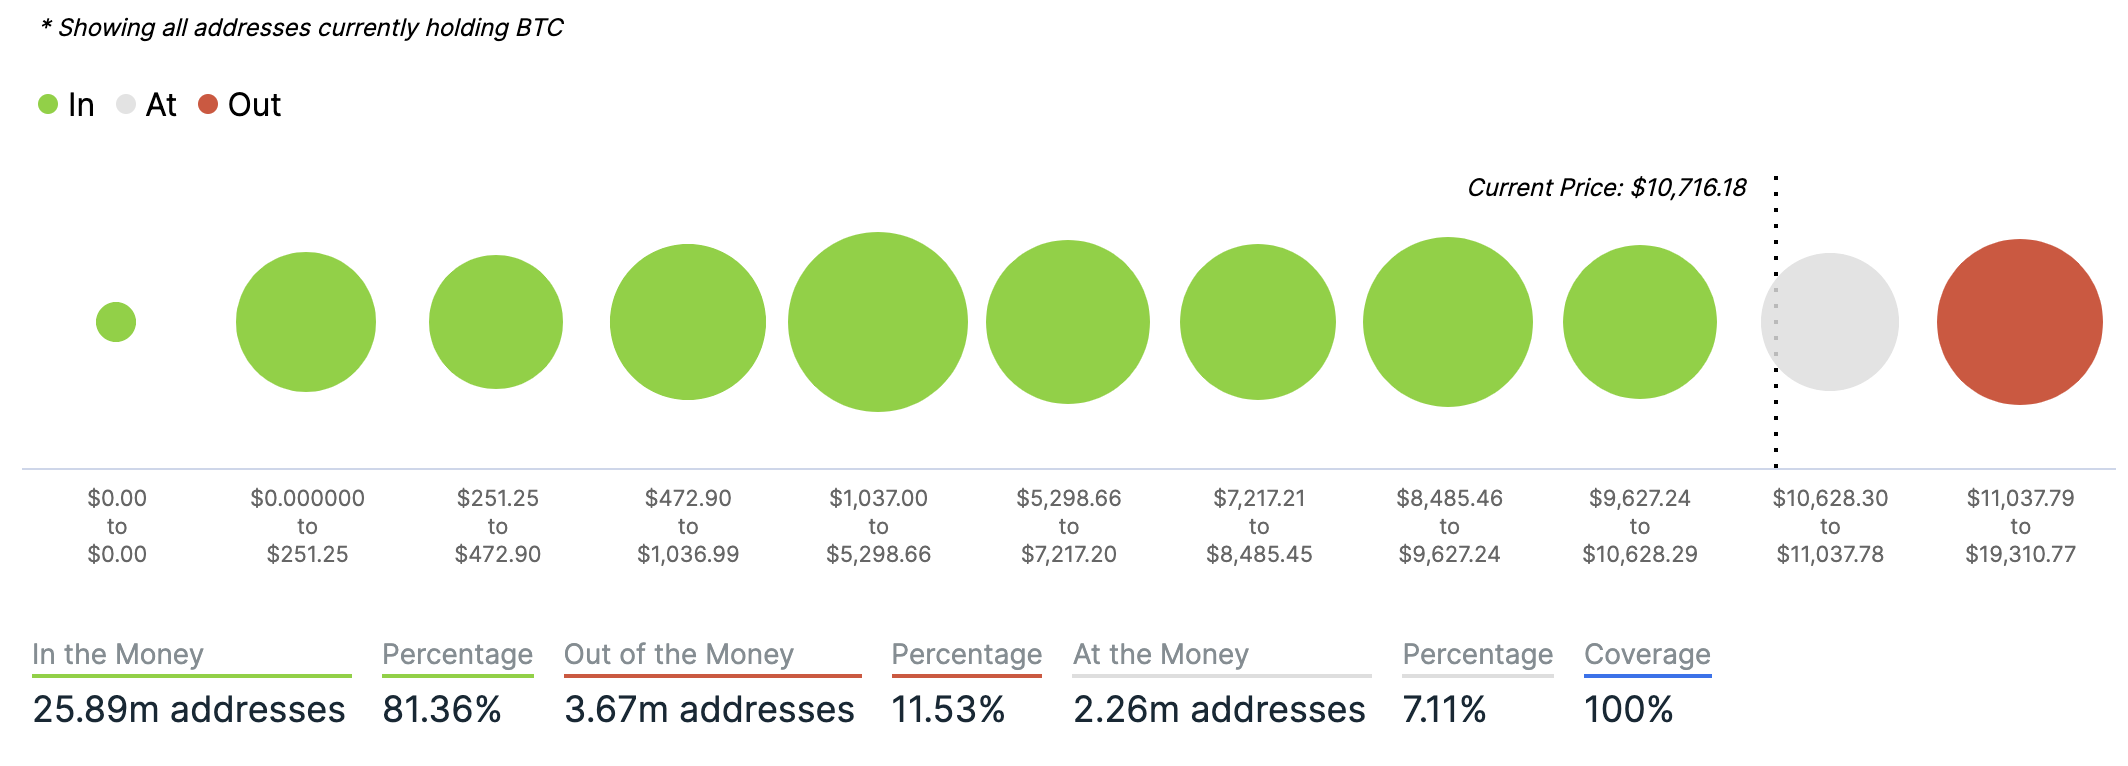
Chart courtesy of IntotheBlock.com
Volatility
Annualised price volatility using 365 days.
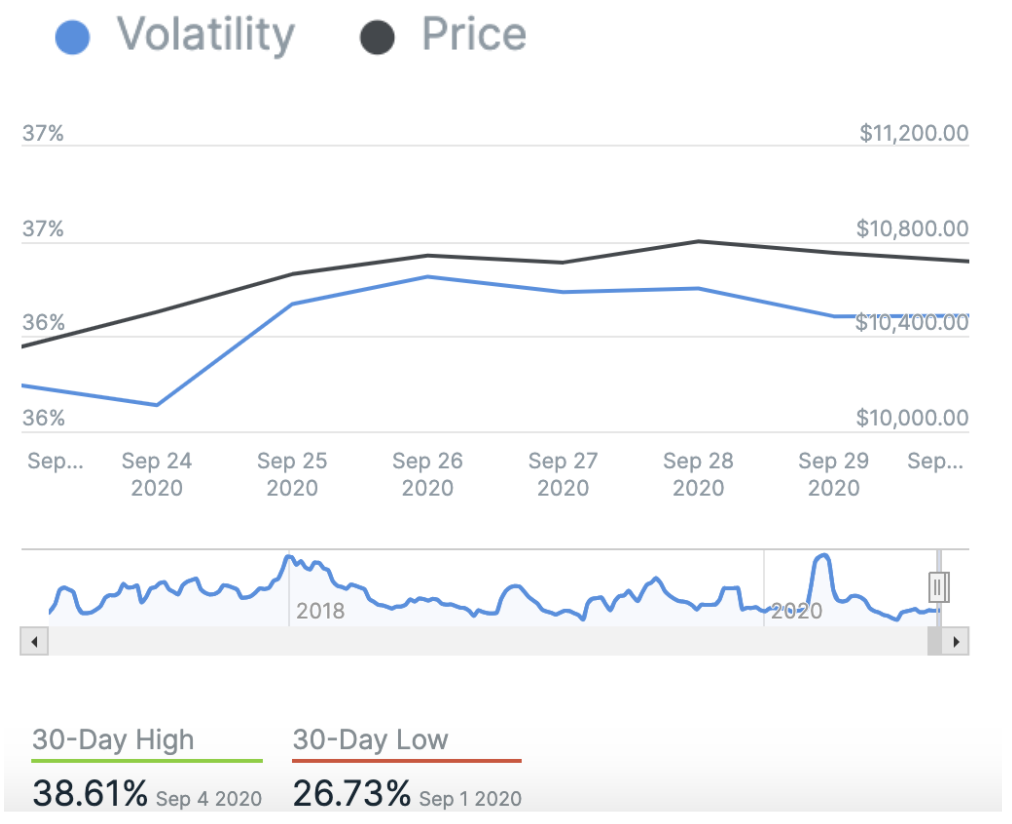
Chart courtesy of IntotheBlock.com
Bitcoin’s market dominance
Bitcoin’s market dominance stands at 59.27. Its lowest recorded dominance was 37.09 on 8 January, 2018.
Relative Strength Index (RSI)
The daily RSI is currently 49.11. Values of 70 or above indicate that an asset is becoming overbought and may be primed for a trend reversal or experience correction in price – an RSI reading of 30 or below indicates an oversold or undervalued condition.
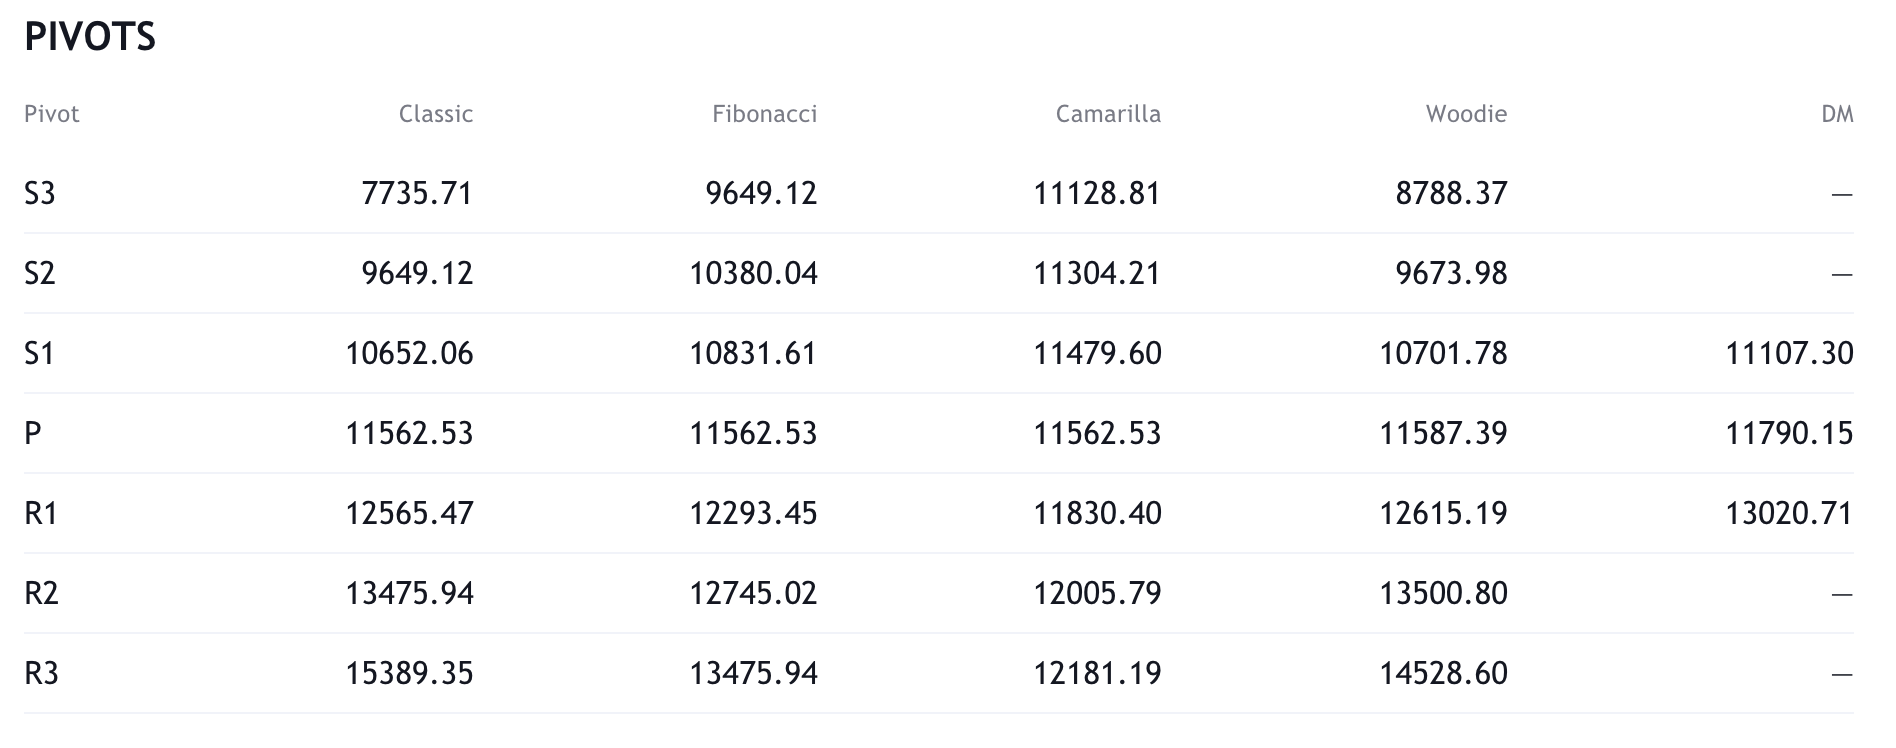
Resistance and support
What they said yesterday…
For the record, the last time we had a presidential debate, the price of #Bitcoin was $617.
— Travis Kling (@Travis_Kling) September 30, 2020
REMINDER: Bitcoin is how you opt out of this nonsense
— Pomp ? (@APompliano) September 30, 2020
Bitcoin and blockchain are the ‘future’ of Twitter, CEO Jack Dorsey reveals: by @BillyBambrough https://t.co/u1leeEvk8m
— Forbes Crypto (@ForbesCrypto) September 29, 2020
Tell me again why #bitcoin is the problem. ?https://t.co/YRQZRrOYHf
— elizabeth stark (@starkness) September 29, 2020
What other data points would you like to see covered in our Daily Report? Let us know on Twitter.
Did you find this useful?