Discover
 Help Centre
 Status
 Company
 Careers
 Press
PressDaily market update: Bitcoin back over $11,000

We’re back, baby! Bitcoin is back over $11,000 for the first time since the beginning of September. Next stop $12,000?

If you’re new to the world of crypto trading and want to know how to best use these indicators to trade, don’t forget to take a look through our beginner’s guide to crypto trading series, featuring in-depth explorations of common strategies, market analysis techniques, and more.
The content of this article is for information purposes only and is not investment advice or any form of recommendation or invitation. Luno always advises you to obtain your own independent financial advice before investing or trading in cryptocurrency.
All information is correct as of 09:30am BST.
Bitcoin price
We closed yesterday, 11 October, 2020, at a price of $11,384.18, with a daily high of $11,428.81 and a low of $11,288.63. That’s the highest daily closing price since 2 September.
On 11 October, 2019, the closing price was $8,321.76. On 11 October, 2018, it was $6,256.24 and the same date in 2017 was $4,826.48.
We’re 43.33% below bitcoin‘s all-time high of $20,089 (17 December 2017).
Bitcoin volume
The volume traded yesterday was $19,968,627,060 – down from $22,877,978,588 the day before. High volume indicates that a significant price movement has stronger support and is more likely to be sustained.
Market capitalisation
Bitcoin’s market capitalisation as of yesterday was $210,766,812,992, up from $209,130,239,495 the day before. To put that into context, Jeff Bezos is currently worth $175.3 billion. This means he can only afford to buy 83.17% of all bitcoin. If you got 83.17% on a maths test, it wouldn’t even be considered a passing grade at some institutions. Sorry Jeff, you fail.
As of today, buying bitcoin has been profitable for…
95.2% of all days since 2013-04-28.
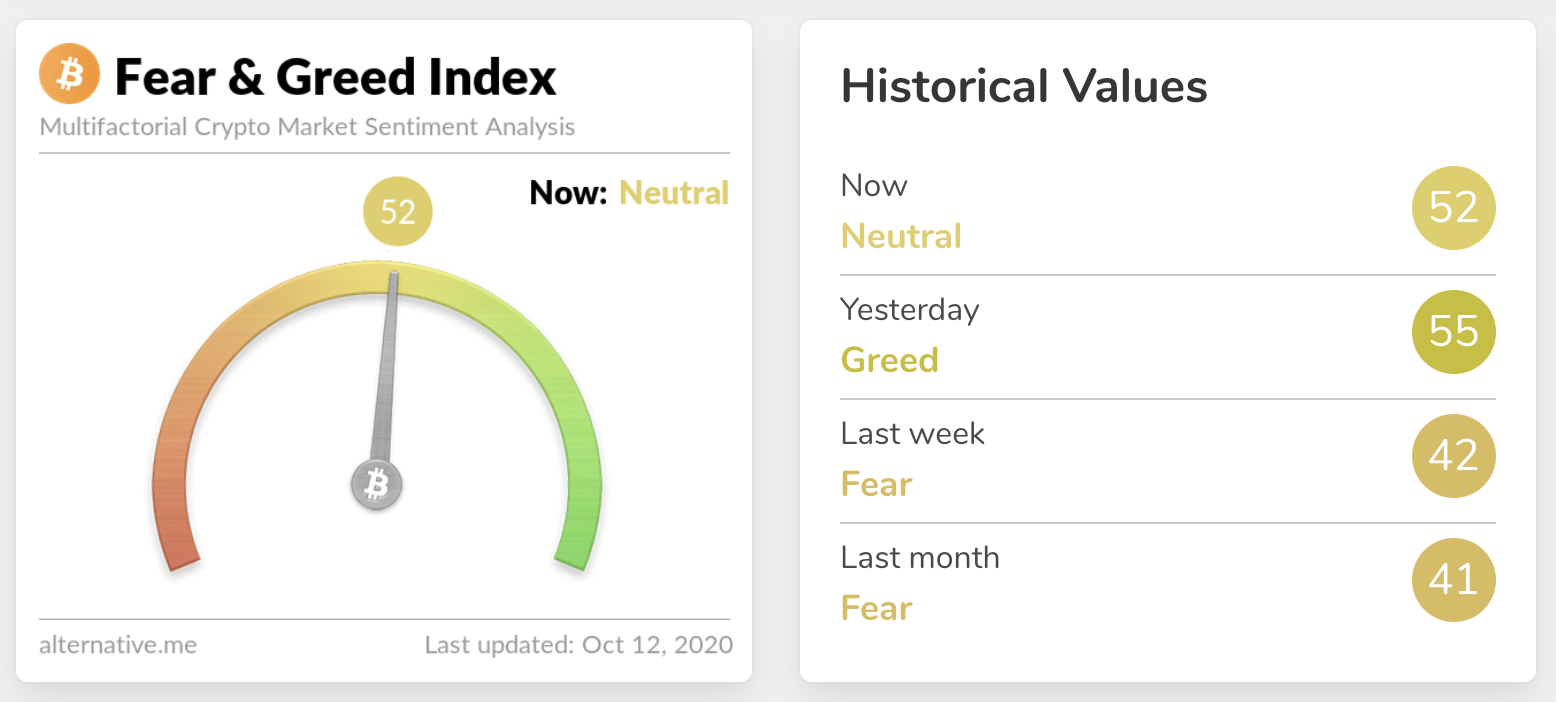
Fear and Greed Index
Sentiment is at 52 – down from 55 the day before. It’s the third day in a row we’ve been back over 50 – still not approaching August’s spell in Extreme Greed but certainly suggesting upward momentum. Extreme fear can be a sign that investors are too worried, which could be a buying opportunity. When Investors are getting too greedy, that means the market may be due for a correction. Are we set for a big move?
Twitter sentiment
Yesterday, there were 9,291 tweets sent with a positive connotation towards bitcoin, 19,037 with a neutral connotation, and 1,320 were negative.
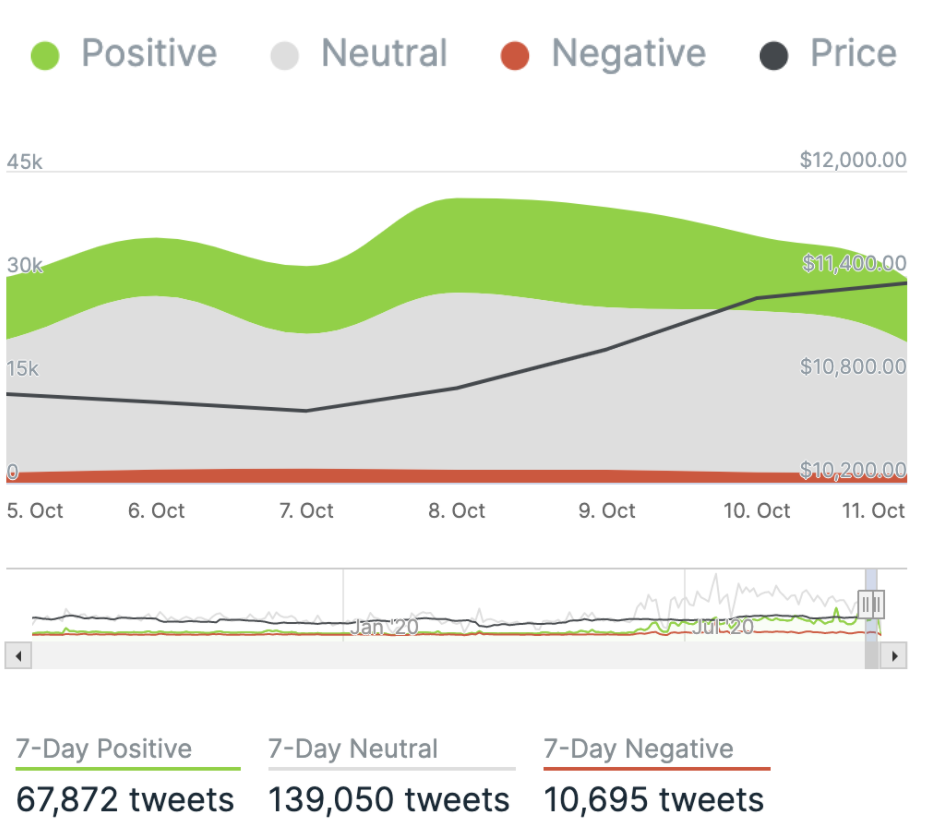
Chart provided by IntoTheBlock.com
Global In/Out of the money
For any address with a balance of tokens, ITB identifies the average price (cost) at which those tokens were purchased and compares it with the current price. If the current price is higher than average cost, address is ‘In the Money’. If the current price is lower than the average cost, the address is ‘Out of the Money’.
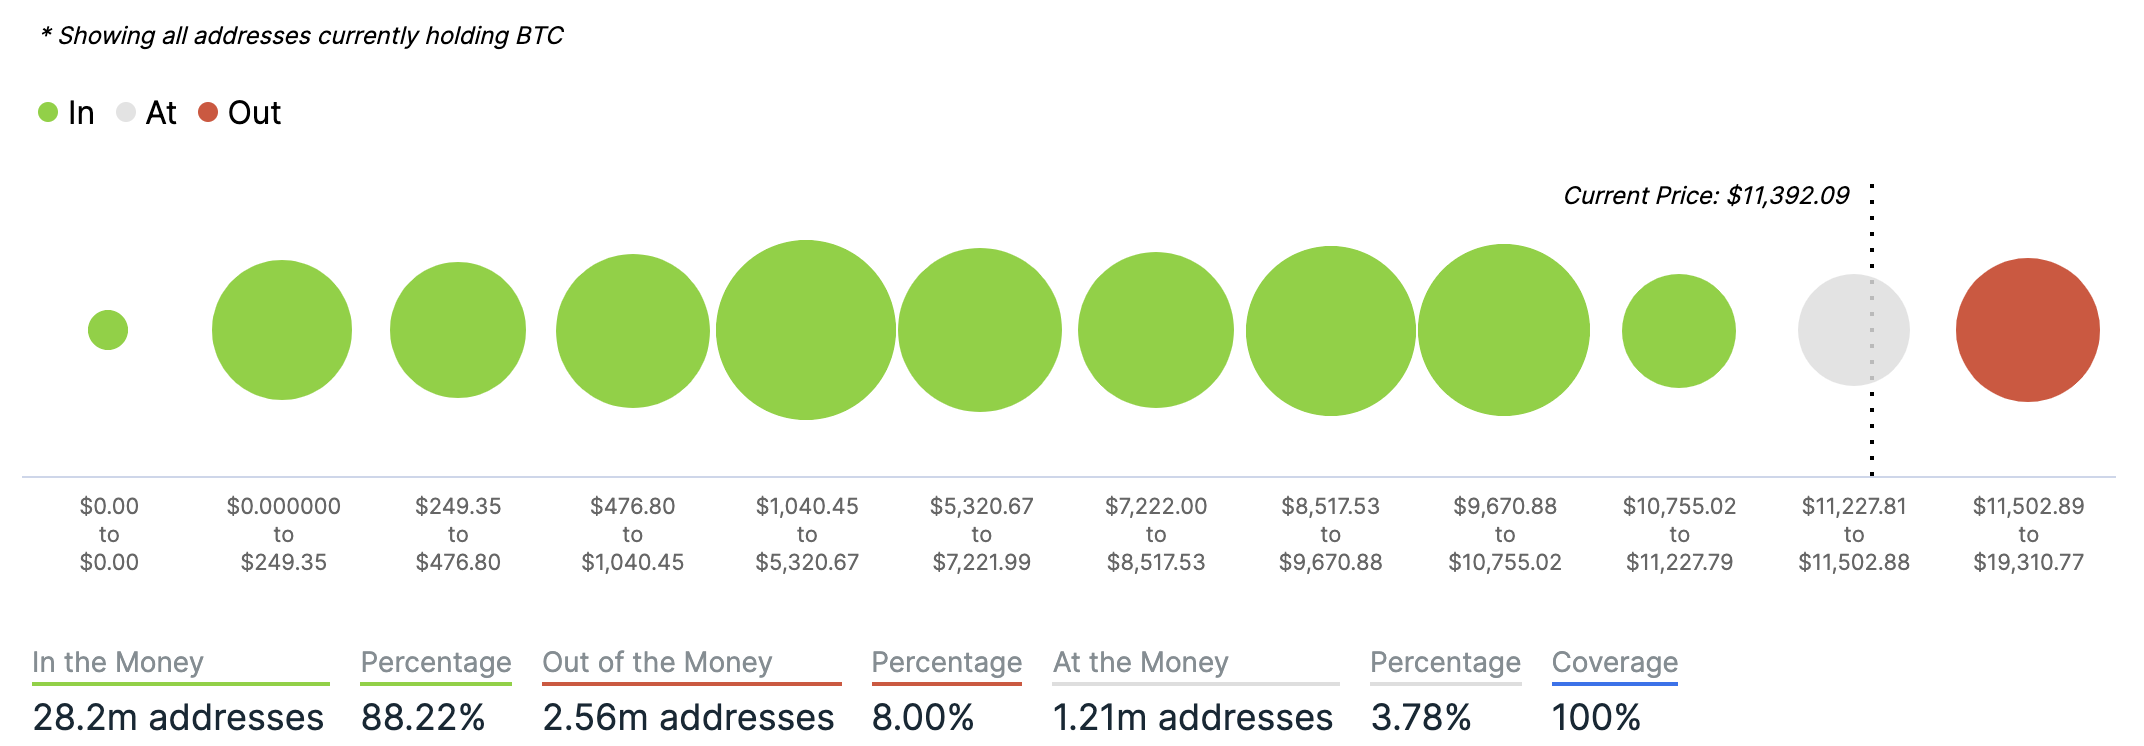
Chart provided by IntoTheBlock.com
Volatility
Annualised price volatility using 365 days.
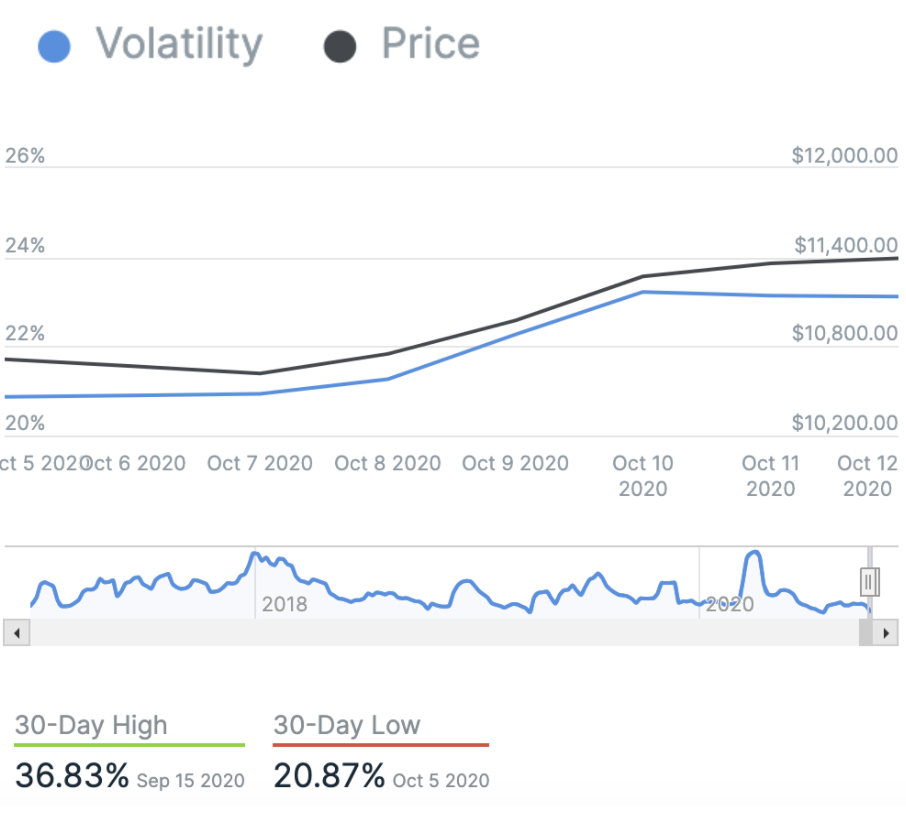
Chart provided by IntoTheBlock.com
Bitcoin’s market dominance
Bitcoin’s market dominance stands at 59.77. Its lowest recorded dominance was 37.09 on 8 January, 2018.
Relative Strength Index (RSI)
The daily RSI is currently 63.84. Values of 70 or above indicate that an asset is becoming overbought and may be primed for a trend reversal or experience correction in price – an RSI reading of 30 or below indicates an oversold or undervalued condition.
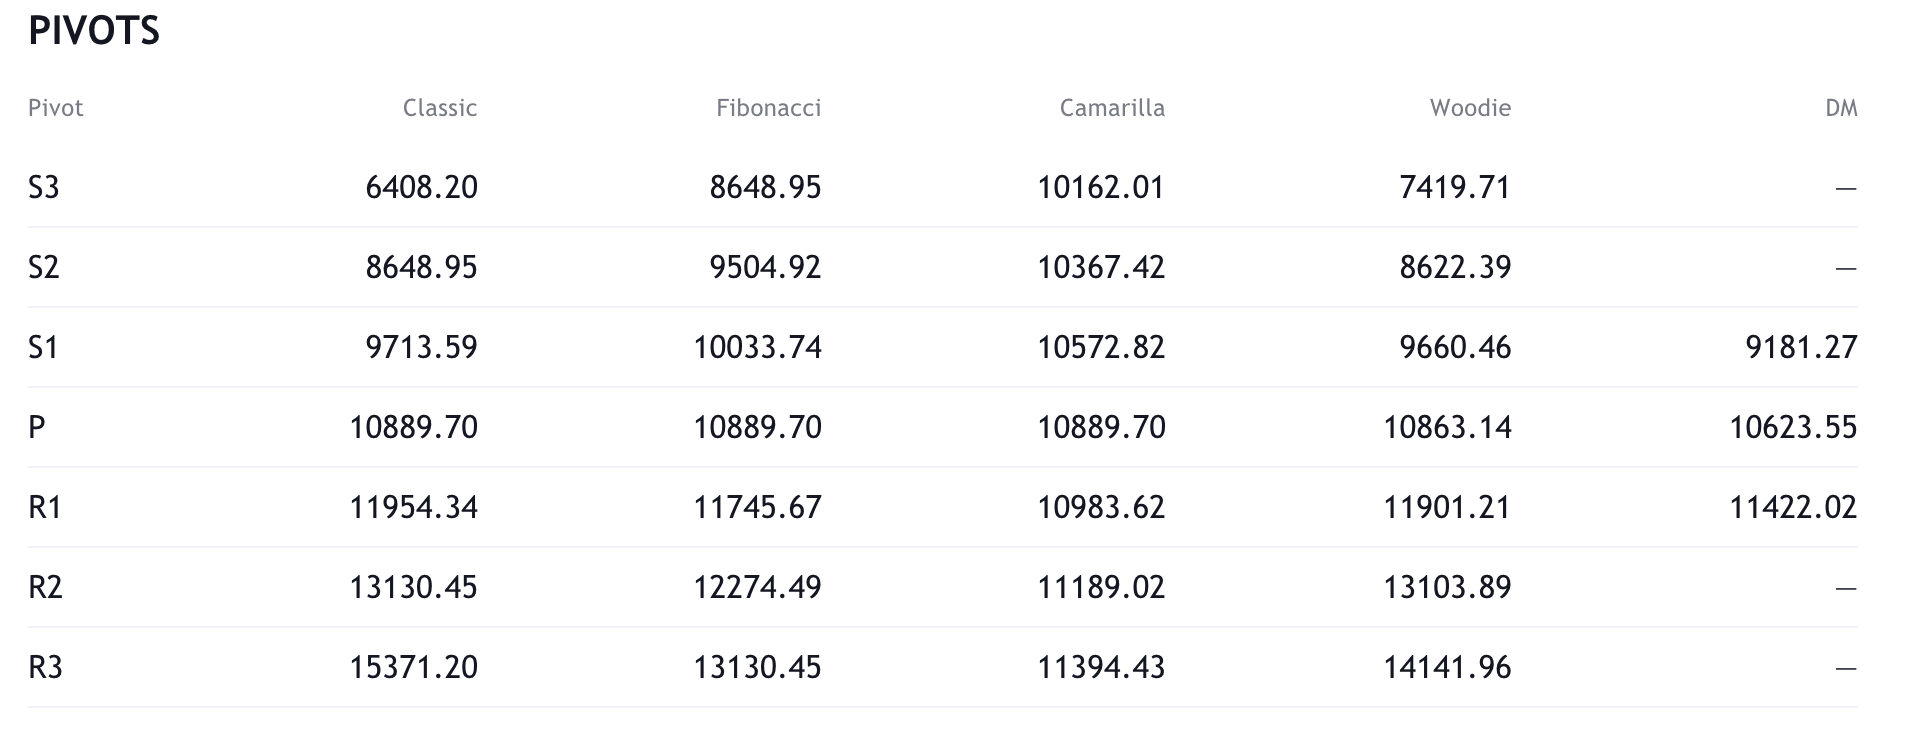
Resistance and support
What they said yesterday…
USD keeps collapsing against Bitcoin. pic.twitter.com/hkkvf0df3u
— Dan Held (@danheld) October 11, 2020
Jeff Bezos’ recalling raising money for Amazon: “It took more than 50 meetings for me to raise $1 million from investors, and over the course of all those meetings, the most common question was, “What’s the internet?”
Sums up my early experiences telling people about #Bitcoin
— Tyler Winklevoss (@tylerwinklevoss) October 11, 2020
SHOCKING: 22% of all US Dollars that exist today were created in 2020!
Only 2.5 million #Bitcoin left to be mined ever.
Make your choice!
— The Moon ? (@TheMoonCarl) October 12, 2020
What other data points would you like to see covered in our Daily Report? Let us know on Twitter.
Did you find this useful?