Discover
 Help Centre
 Status
 Company
 Careers
 Press
PressDaily market update: Bitcoin back over $16,000 ?

After a week of waiting, watching, and wishing, bitcoin is back again over $16,000. Yesterday was bitcoin’s 13th highest ever closing price in its short-but-magnificent history. Even CNBC is talking about it again. Sentiment is high, volume is high, and the price is high – where to next?

Here’s your daily market update. If you’re new to the world of cryptocurrency, take a look through our beginner’s guide to crypto trading series to get a better idea of all these indicators, starring in-depth explorations of common strategies, market analysis techniques, and more.
The content of this article is for information purposes only and is not investment advice or any form of recommendation or invitation. Luno always advises you to obtain your own independent financial advice before investing or trading in cryptocurrency.
All information is correct as of 09:00am GMT.
Bitcoin price
We closed yesterday, 12 November, 2020, at a price of $16,276.34 – up from $15,701.34 the day before. That’s an increase of 3.66%. It’s the first time we’ve closed over $16,000 since 7 January, 2018.
The daily high was $16,305.00, while the daily low was $15,534.77. This time last year, the price of bitcoin was $8,815.66 and in 2018 it was $6,371.27.
We’re 18.98% below bitcoin‘s all-time high of $20,089 (17 December 2017).
Bitcoin volume
The volume traded yesterday was $34,175,758,344, up from $29,772,374,934 the day before. High volume indicates that a significant price movement has stronger support and is more likely to be sustained.
Market capitalisation
Bitcoin’s market capitalisation as of yesterday was $301,736,853,825, up from $291,077,214,052 the day before. That’s the highest it’s been since 18 December, 2017. It’s only the fifth day in Bitcoin’s history that it’s been over $300,000,000,000.
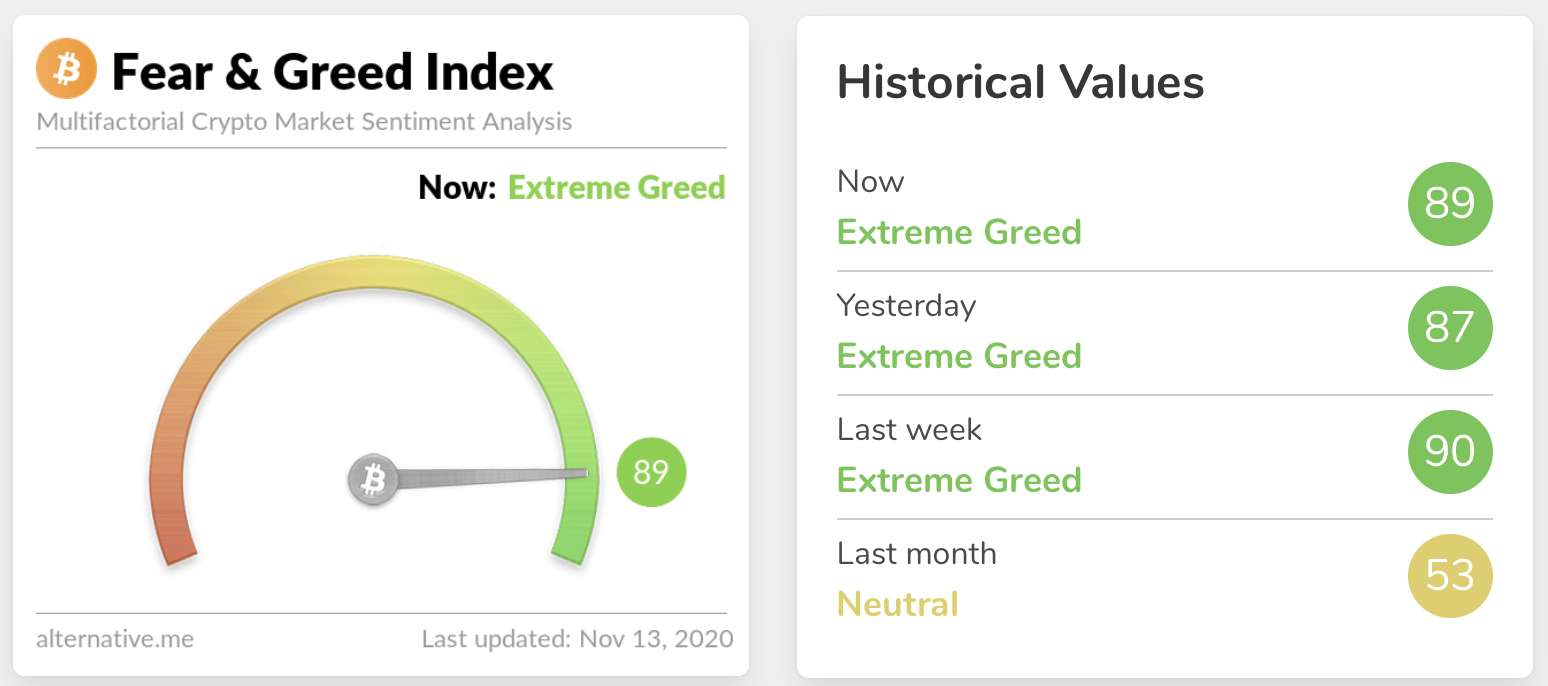
Fear and Greed Index
The sentiment is still in Extreme Greed, up to 89 from 87. Extreme fear can indicate that investors are getting too worried and there’s an opportunity for buyers, while extreme greed could mean the market is due for a correction.
In/Out of the money
For any address with a balance of tokens, ITB identifies the average price (cost) at which those tokens were purchased and compares it with the current price. If the current price is higher than average cost, address is ‘In the Money’. If the current price is lower than the average cost, the address is ‘Out of the Money’.
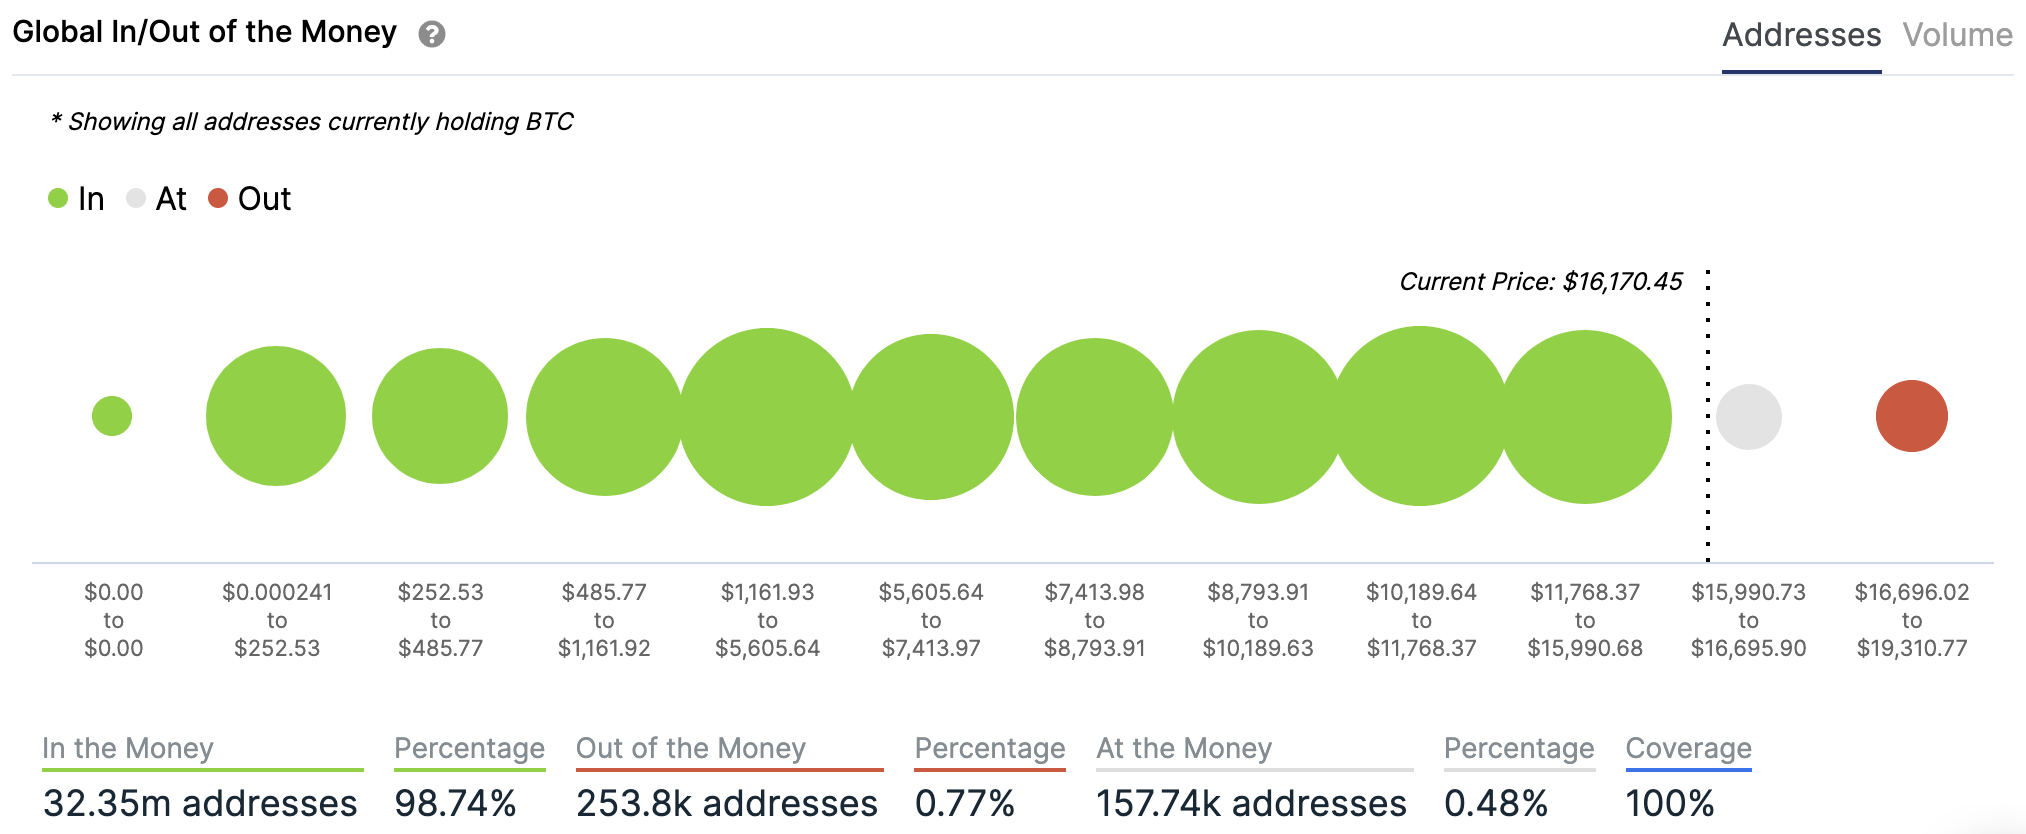
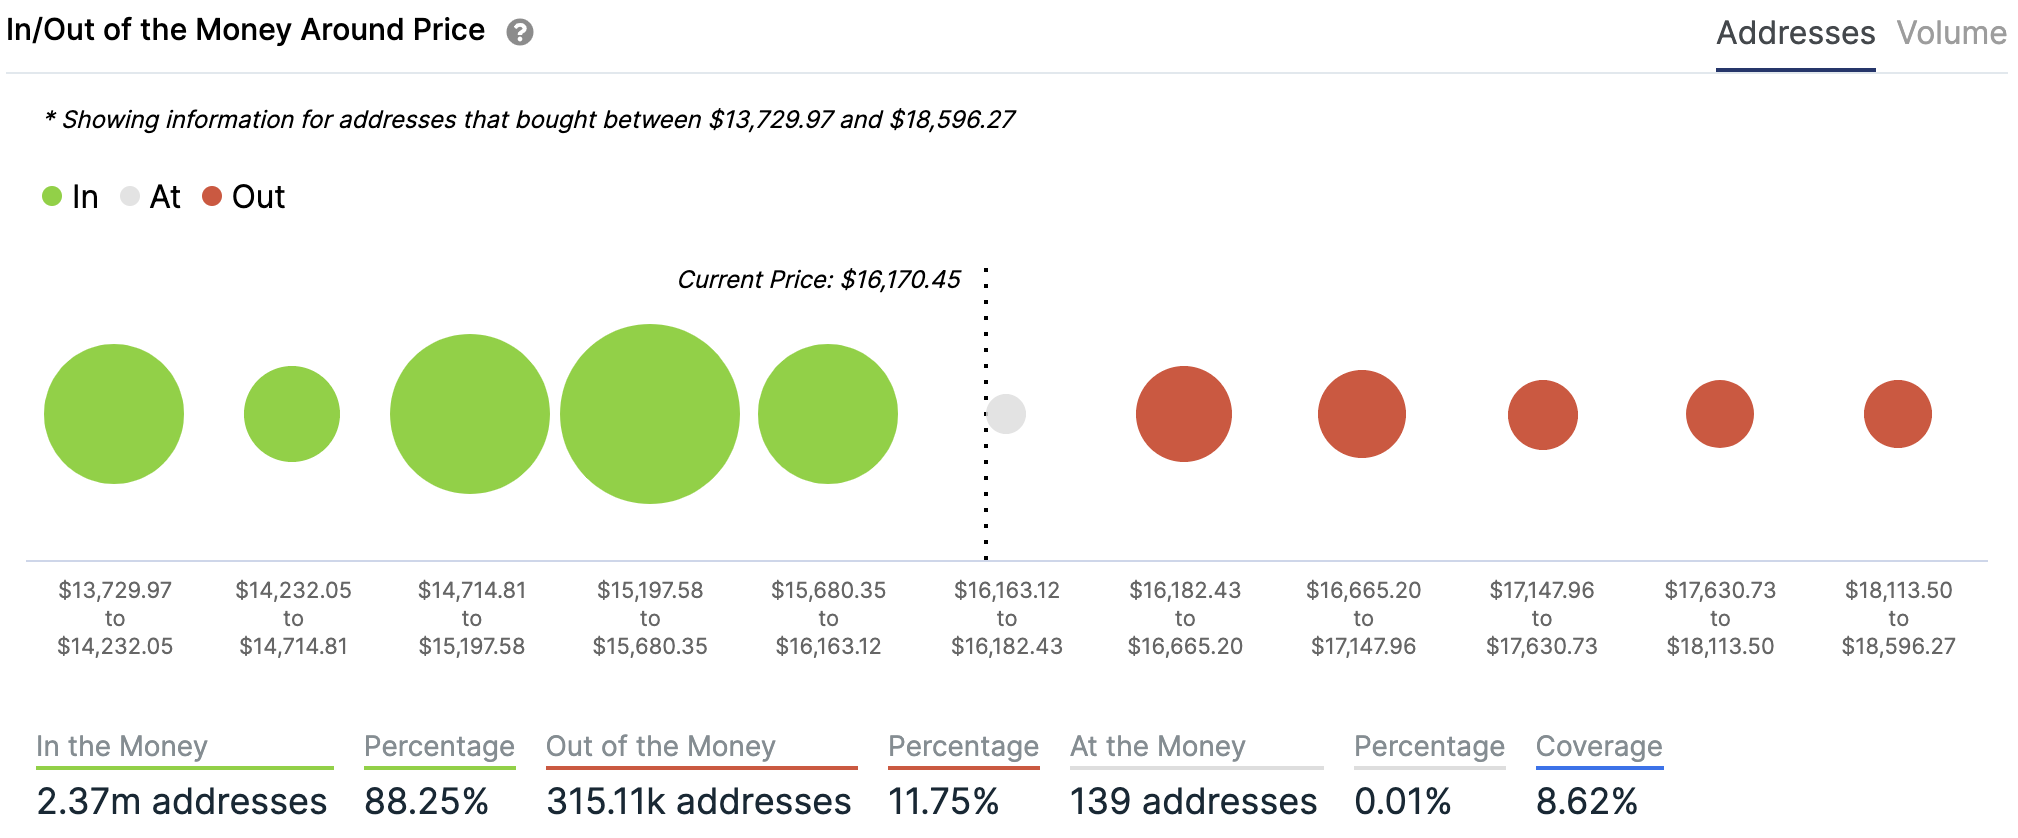
Chart provided by IntoTheBlock.com
Volatility
Annualised price volatility using 365 days.
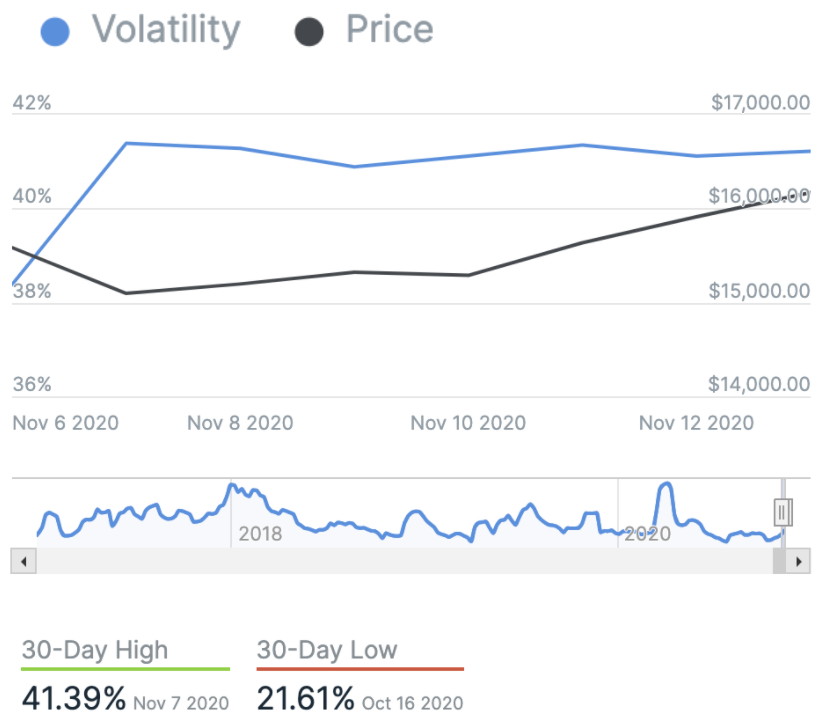
Chart provided by IntoTheBlock.com
Twitter sentiment
Yesterday, there were 13,109 tweets sent with a positive connotation towards bitcoin, 33,590 with a neutral connotation, and 2,394 were negative.
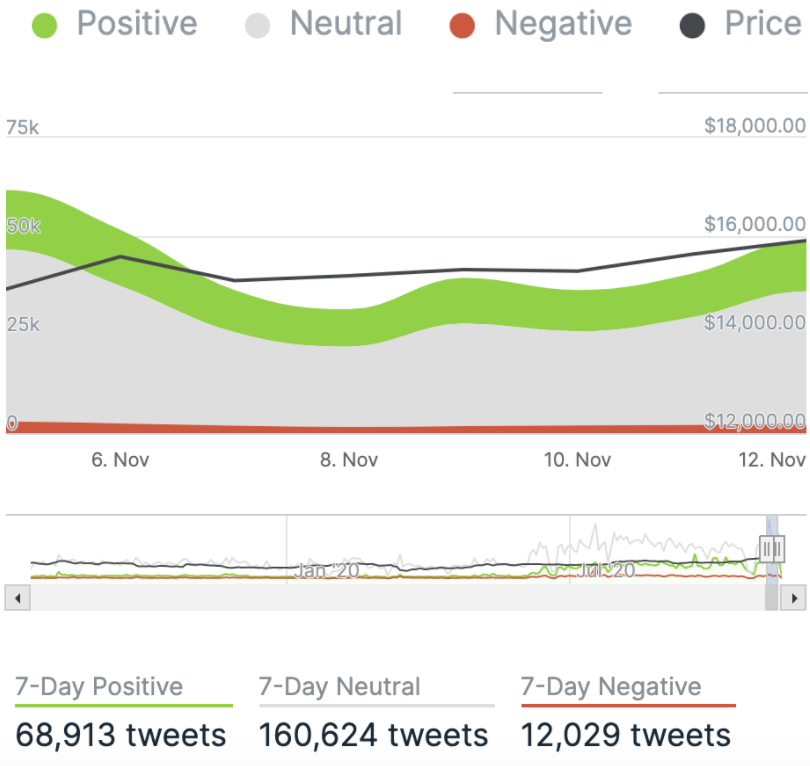
Chart provided by IntoTheBlock.com
Bitcoin’s market dominance
Bitcoin’s market dominance stands at 65.62. Its lowest recorded dominance was 37.09 on 8 January, 2018.
Relative Strength Index (RSI)
The daily RSI is currently 76.47. Values of 70 or above indicate that an asset is becoming overbought and may be primed for a trend reversal or experience a correction in price – an RSI reading of 30 or below indicates an oversold or undervalued condition.
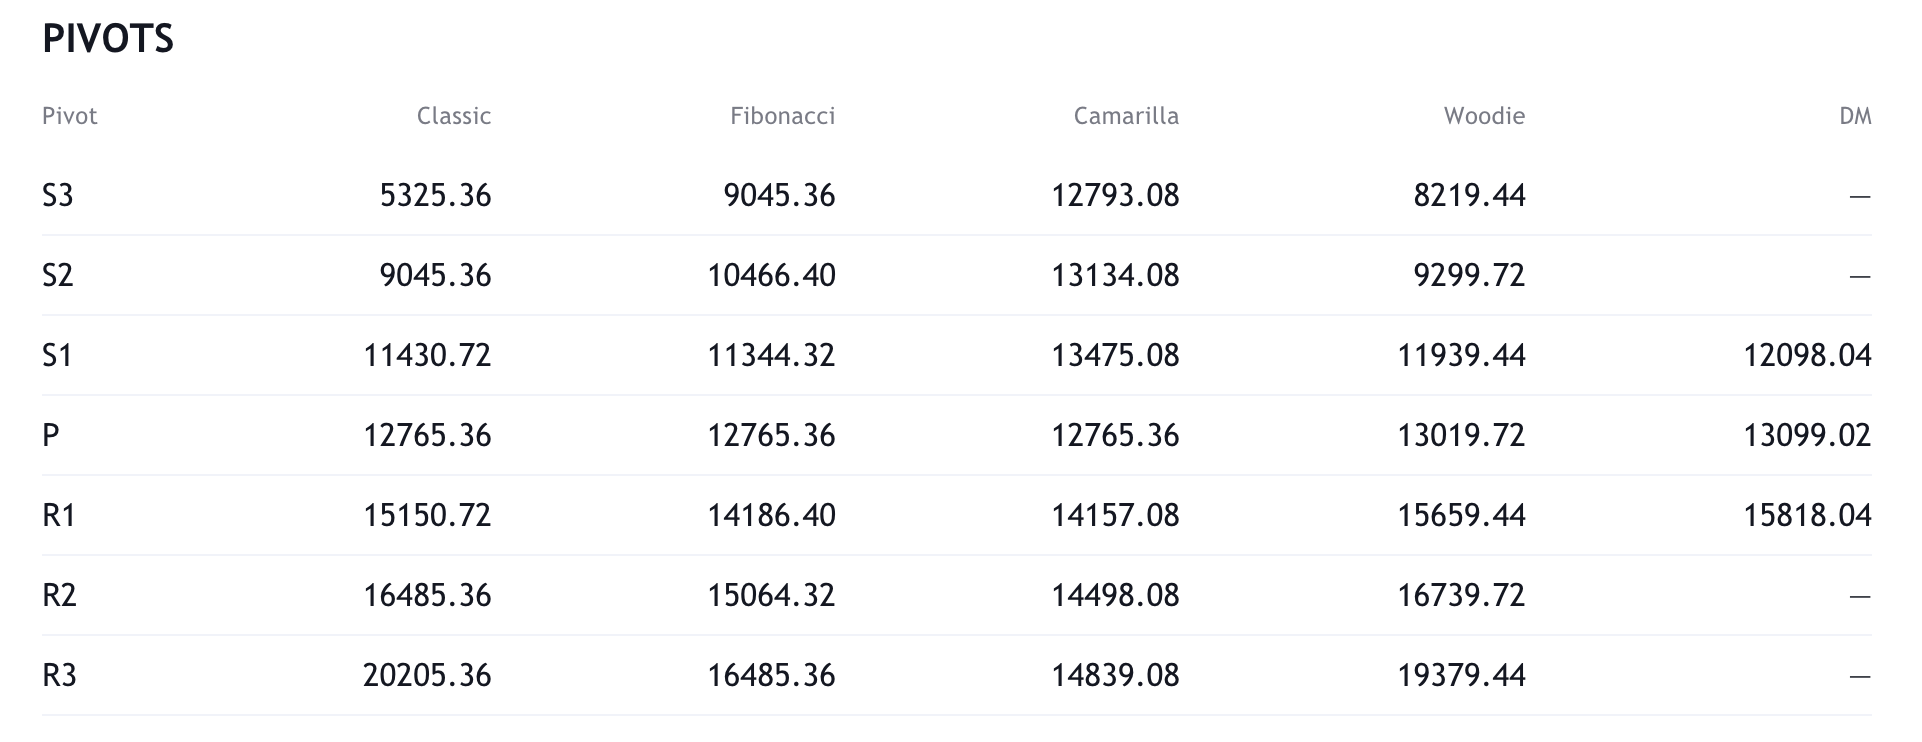
Resistance and support
What they said yesterday…
Bitcoin bounces back! The cryptocurrency broke above $16,000 today for the first time since 2018 as investors jumped back into the trade. Bitcoin Baller @BKBrianKelly looks at what could fuel the bullish boom. pic.twitter.com/6cUegXrhPW
— CNBC’s Fast Money (@CNBCFastMoney) November 12, 2020
We just closed the 13th highest daily close in #Bitcoin history.
Top daily closes #Bitcoin pic.twitter.com/YBjwcvUcYc
— Jimmy Song (송재준) (@jimmysong) November 13, 2020
Not only is spot volume for Bitcoin reaching 2020 highs, but institutional interest has also been rampant throughout November. Open interest for Bitcoin futures at CME also surged to near all-time highs last week at $934 million. pic.twitter.com/g3K5Z6SieZ
— Oliver Isaacs (@oliverzok) November 13, 2020
But professor…
When you told me #Bitcoin was a Ponzi scheme you left out the part about the four-year halving cycle and two-week difficulty adjustment…
How does that work?
//Thread Post 1 pic.twitter.com/nJAyyXTVNS
— Preston Pysh (@PrestonPysh) November 13, 2020
What other data points would you like to see covered in our Daily Report? Let us know on Twitter.
Did you find this useful?