Discover
 Help Centre
 Status
 Company
 Careers
 Press
PressDaily market update: Bitcoin hits $13,000 again, is $14,000 next?

It’s Friday and we’re ending the week with a bang! Another day, another $13,000 high for bitcoin. Paul Tudor Jones is bullish (see interview below), the Winklevii are bullish, we’re bullish… are you bullish?
If you’re new to the world of crypto trading and want to make sense of all these indicators, check out our beginner’s guide to crypto trading series, featuring in-depth explorations of common strategies, market analysis techniques, and more.
The content of this article is for information purposes only and is not investment advice or any form of recommendation or invitation. Luno always advises you to obtain your own independent financial advice before investing or trading in cryptocurrency.
All information is correct as of 09:30am BST.
Bitcoin price
We closed yesterday, 21 October, 2020, at a price of $12,965.89, with a daily high of $13,161.59 and a low of $12,717.09.
We’re 34.46% below bitcoin‘s all-time high of $20,089 (17 December 2017).
As of today, buying bitcoin has been profitable for…
98.2% of all days since 2013-04-28.
Bitcoin volume
The volume traded yesterday was $34,729,759,598 – down from $ 43,414,712,626 the day before. That’s the highest daily trading volume since 11 September. High volume indicates that a significant price movement has stronger support and is more likely to be sustained.
Market capitalisation
Bitcoin’s market capitalisation as of yesterday was $240,166,387,522, up from $237,532,386,963 the day before. That’s the highest the market cap has been since 13 January 2018.
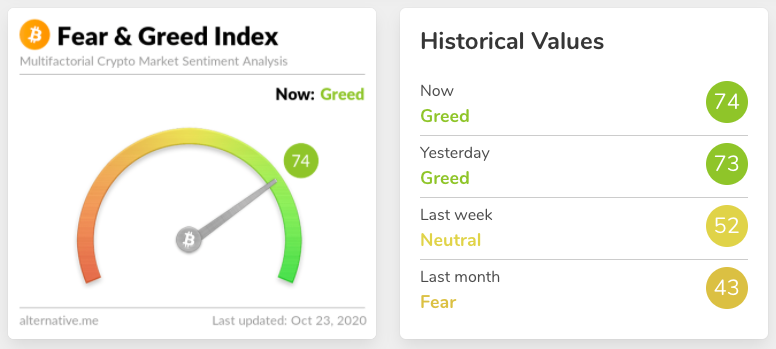
Fear and Greed Index
The sentiment continues to rise, up from 73 to 74 today. Extreme fear can be a sign that investors are too worried, which could be a buying opportunity. When Investors are getting too greedy, that means the market may be due for a correction.
Global In/Out of the money
For any address with a balance of tokens, ITB identifies the average price (cost) at which those tokens were purchased and compares it with the current price. If the current price is higher than average cost, address is ‘In the Money’. If the current price is lower than the average cost, the address is ‘Out of the Money’.
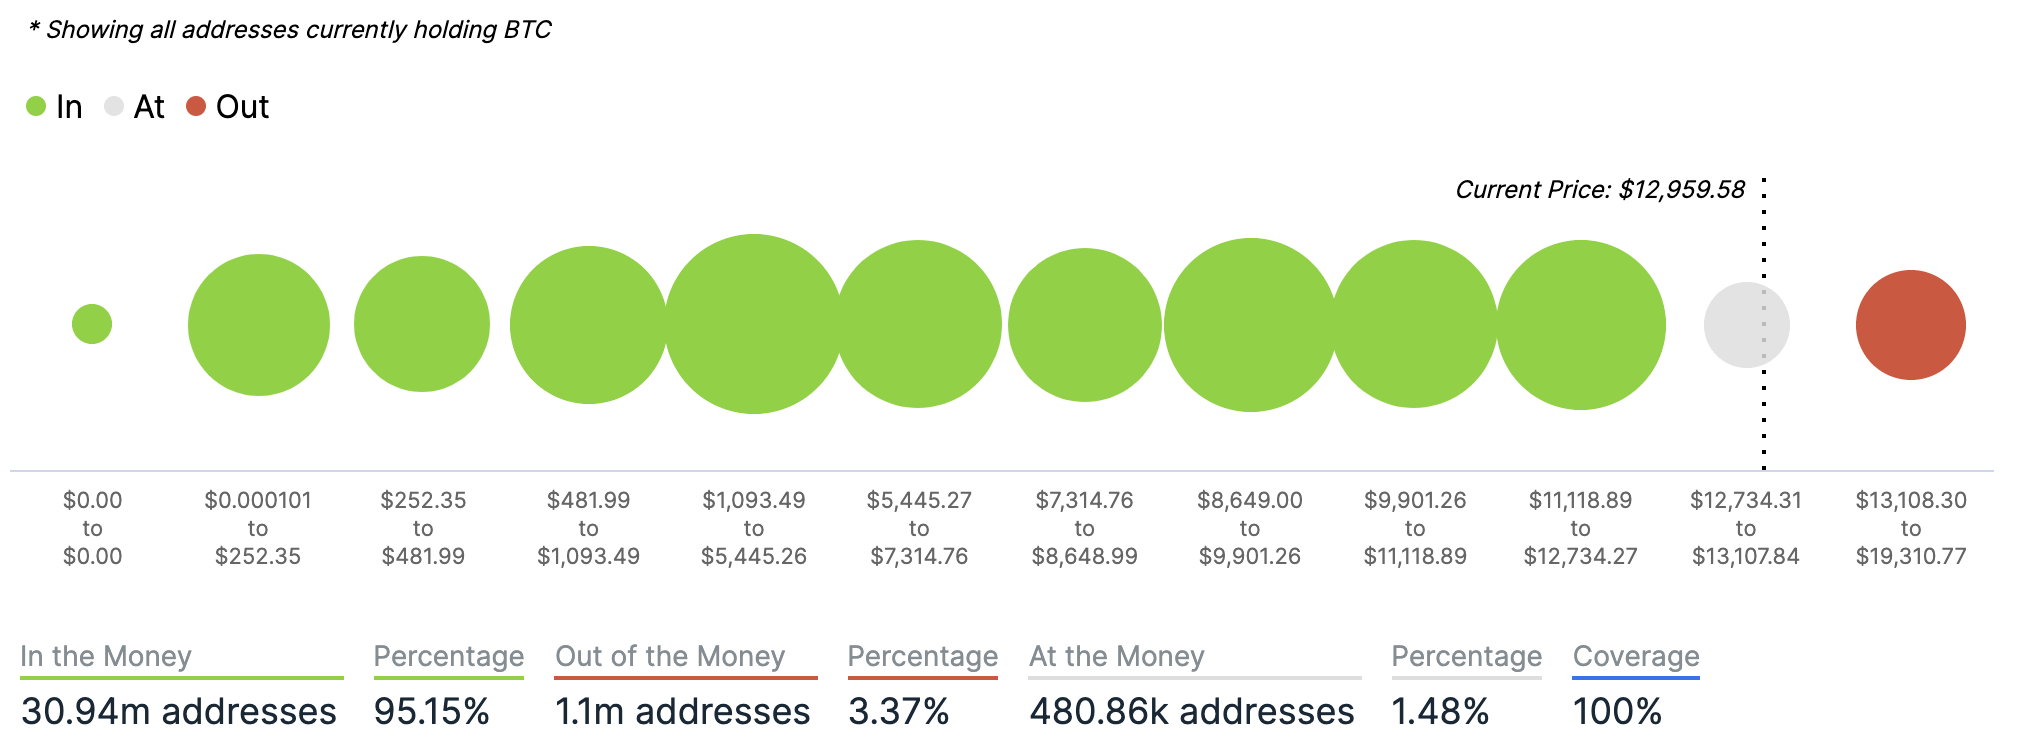
Chart provided by IntoTheBlock.com
Volatility
Annualised price volatility using 365 days.
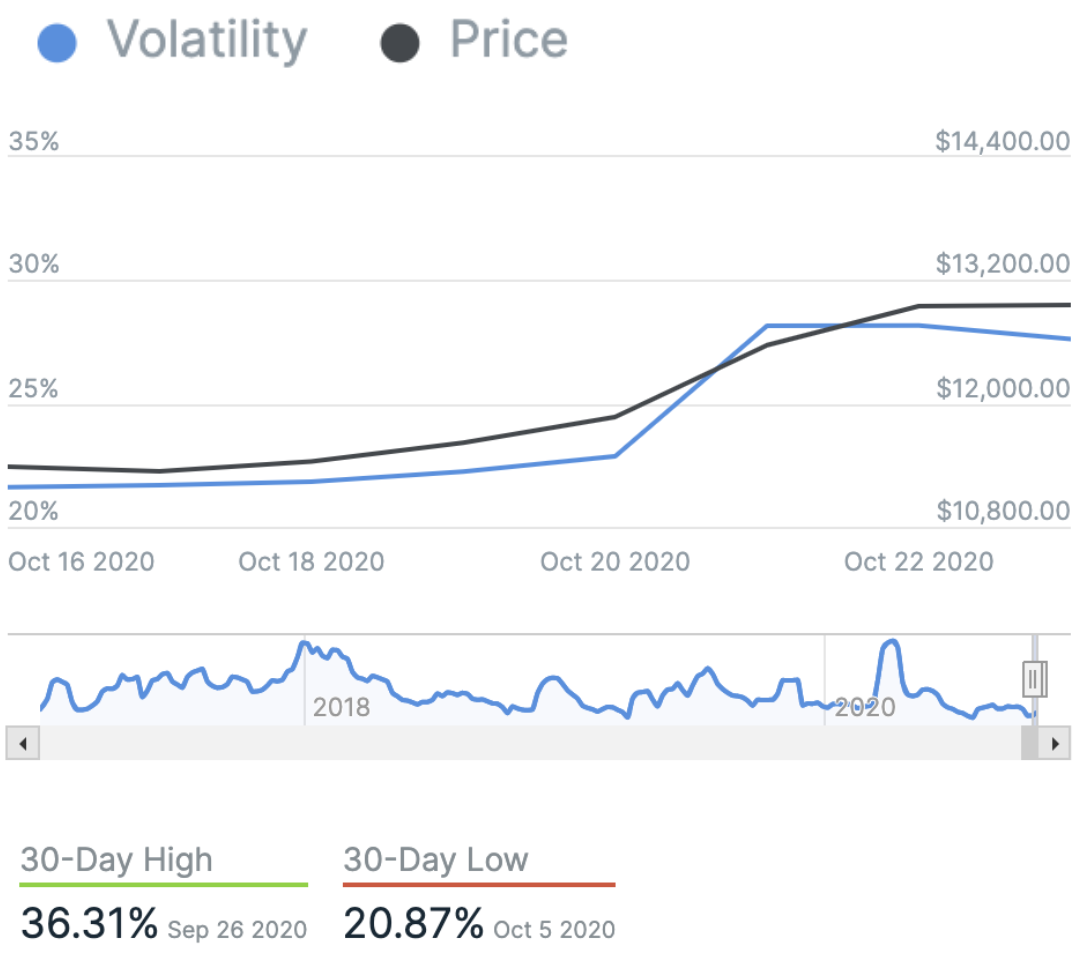
Chart provided by IntoTheBlock.com
Bitcoin’s market dominance
Bitcoin’s market dominance stands at 61.73. Its lowest recorded dominance was 37.09 on 8 January, 2018.
Relative Strength Index (RSI)
The daily RSI is currently 79.91. Values of 70 or above indicate that an asset is becoming overbought and may be primed for a trend reversal or experience correction in price – an RSI reading of 30 or below indicates an oversold or undervalued condition.
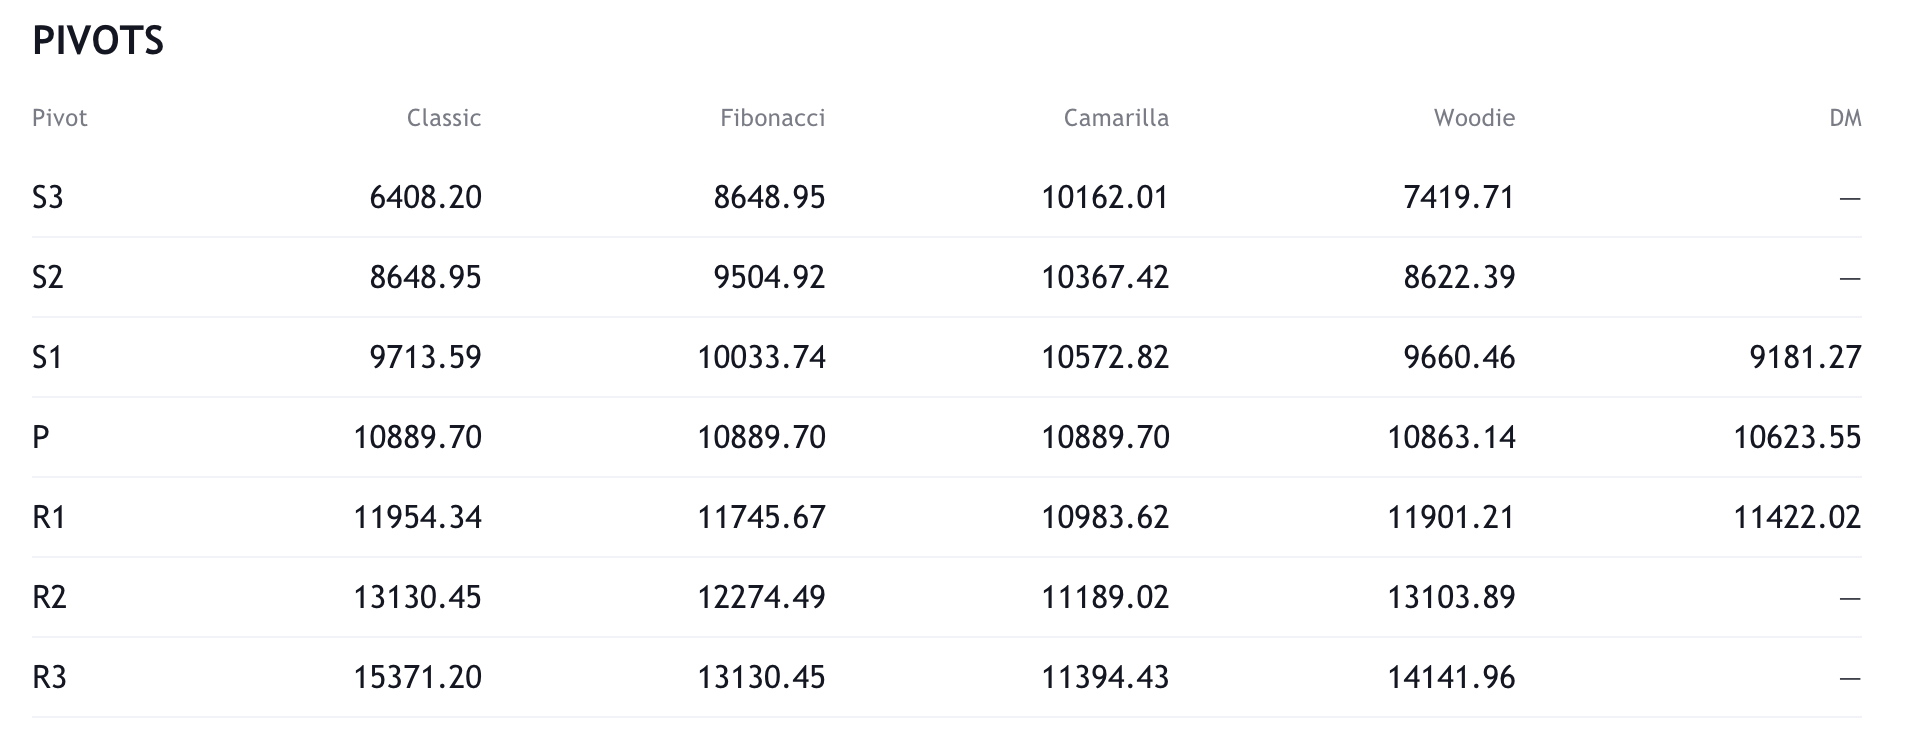
Resistance and support
What they said yesterday…
“I came to the conclusion that #btc was going to be the best of the inflation trades–the defensive trades,” says Paul Tudor Jones. “Bitcoin has a lot of characteristics of being an early investor in a tech company…it’s like investing with Steve Jobs and Apple.” pic.twitter.com/4760iQBrOy
— Squawk Box (@SquawkCNBC) October 22, 2020
Even I bought bitcoin today after seeing the Paul Tudor Jones interview on CNBC w @andrewrsorkin
— Barry Silbert (@BarrySilbert) October 22, 2020
Gold is breaking down versus bitcoin, as expected cc: @michael_saylor Everyone take note. The next thing I’m expecting is the correlations between BTC and the dollar and BTC vs equities to break down too… let’s see. #Bitcoin pic.twitter.com/RoPUSFbmvZ
— Raoul Pal (@RaoulGMI) October 22, 2020
#Bitcoin just chilling above 13k and the week’s not even over yet
— Tyler Winklevoss (@tylerwinklevoss) October 22, 2020
What other data points would you like to see covered in our Daily Report? Let us know on Twitter.
Did you find this useful?