Discover
 Help Centre
 Status
 Company
 Careers
 Press
PressDaily market update: Bitcoin hits all-time high market cap

Will the bitcoin price ever stop going up? Not only did the bitcoin price hit $17,000 yesterday, last night it burst through $18,000 again for the first time since December 2017. The market cap is also now the highest it’s ever been. What’s driving the rise this time? The halving? The arrival of institutional investors? PayPal entering the market in the US? Answers on a postcard. Or Twitter, whatever’s easier.
Here’s your daily market update. If you’re new to the world of crypto, take a look through our beginner’s guide to crypto trading series to get a better idea of all these indicators, starring in-depth explorations of common strategies, market analysis techniques, and more.
The content of this article is for information purposes only and is not investment advice or any form of recommendation or invitation. Luno always advises you to obtain your own independent financial advice before investing or trading in cryptocurrency.
All information is correct as of 08:30am GMT.
Bitcoin price
We closed yesterday, 17 November, 2020, at a price of $17,645.41 – up from $16,716.11 the day before. That’s an increase of 5.56%. It’s the highest closing price since 19 December, 2017. At time of writing, the price of one bitcoin is $18,143.09.
The daily high was $17,782.92, while the daily low was $16,564.54.
This time last year, the price of bitcoin was $8,577.98 and in 2018 it was $5,554.33.
We’re 12.16% below bitcoin‘s all-time high of $20,089 (17 December 2017).
As of today, buying bitcoin has been profitable for…
99.6% of all days since 2013-04-28.
Bitcoin volume
The volume traded yesterday was $39,006,849,170, up from $31,526,766,675 the day before. High volume indicates that a significant price movement has stronger support and is more likely to be sustained.
Market capitalisation
Bitcoin’s market capitalisation as of yesterday was $327,257,094,857, up from $309,889,423,249 the day before. This is the highest that Bitcoin’s market cap has ever been. The previous record was when bitcoin hit an all-time high of $326,502,485,530 in December 2017. The reason the price was higher then but the market cap lower, was that there were less bitcoin in circulation at the time. Find out more about how they’re mined.
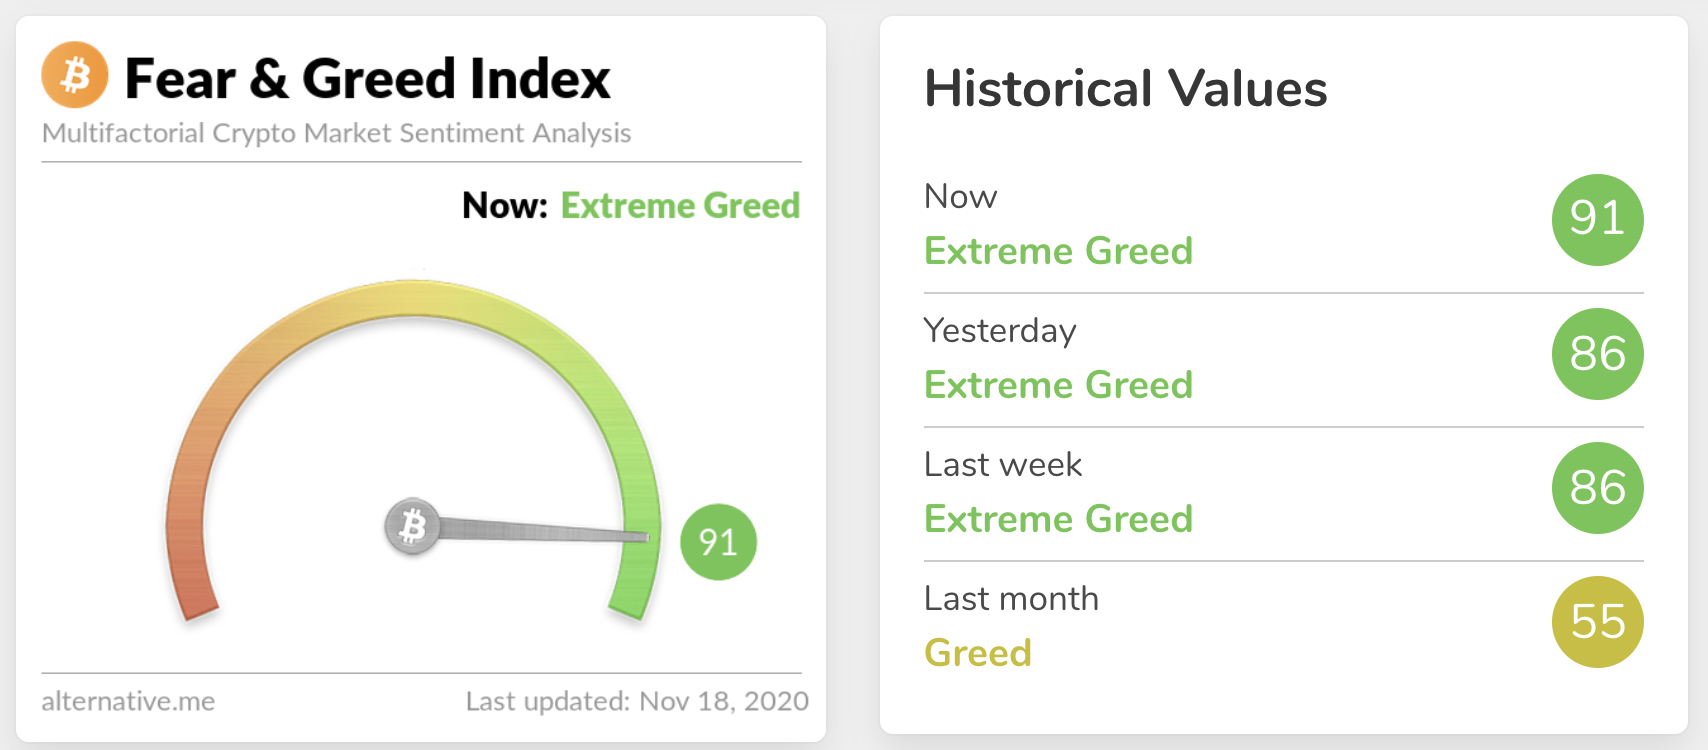
Fear and Greed Index
The sentiment is in Extreme Greed again, up to 91 today. While the sentiment right now is around the highest we have seen according to this index, we should keep in mind that it didn’t exist during the 2017 bull run, and it’s hard to tell how it would have looked then. But as we always highlight, the index doesn’t stay this high very often, and a pullback would not be surprising.
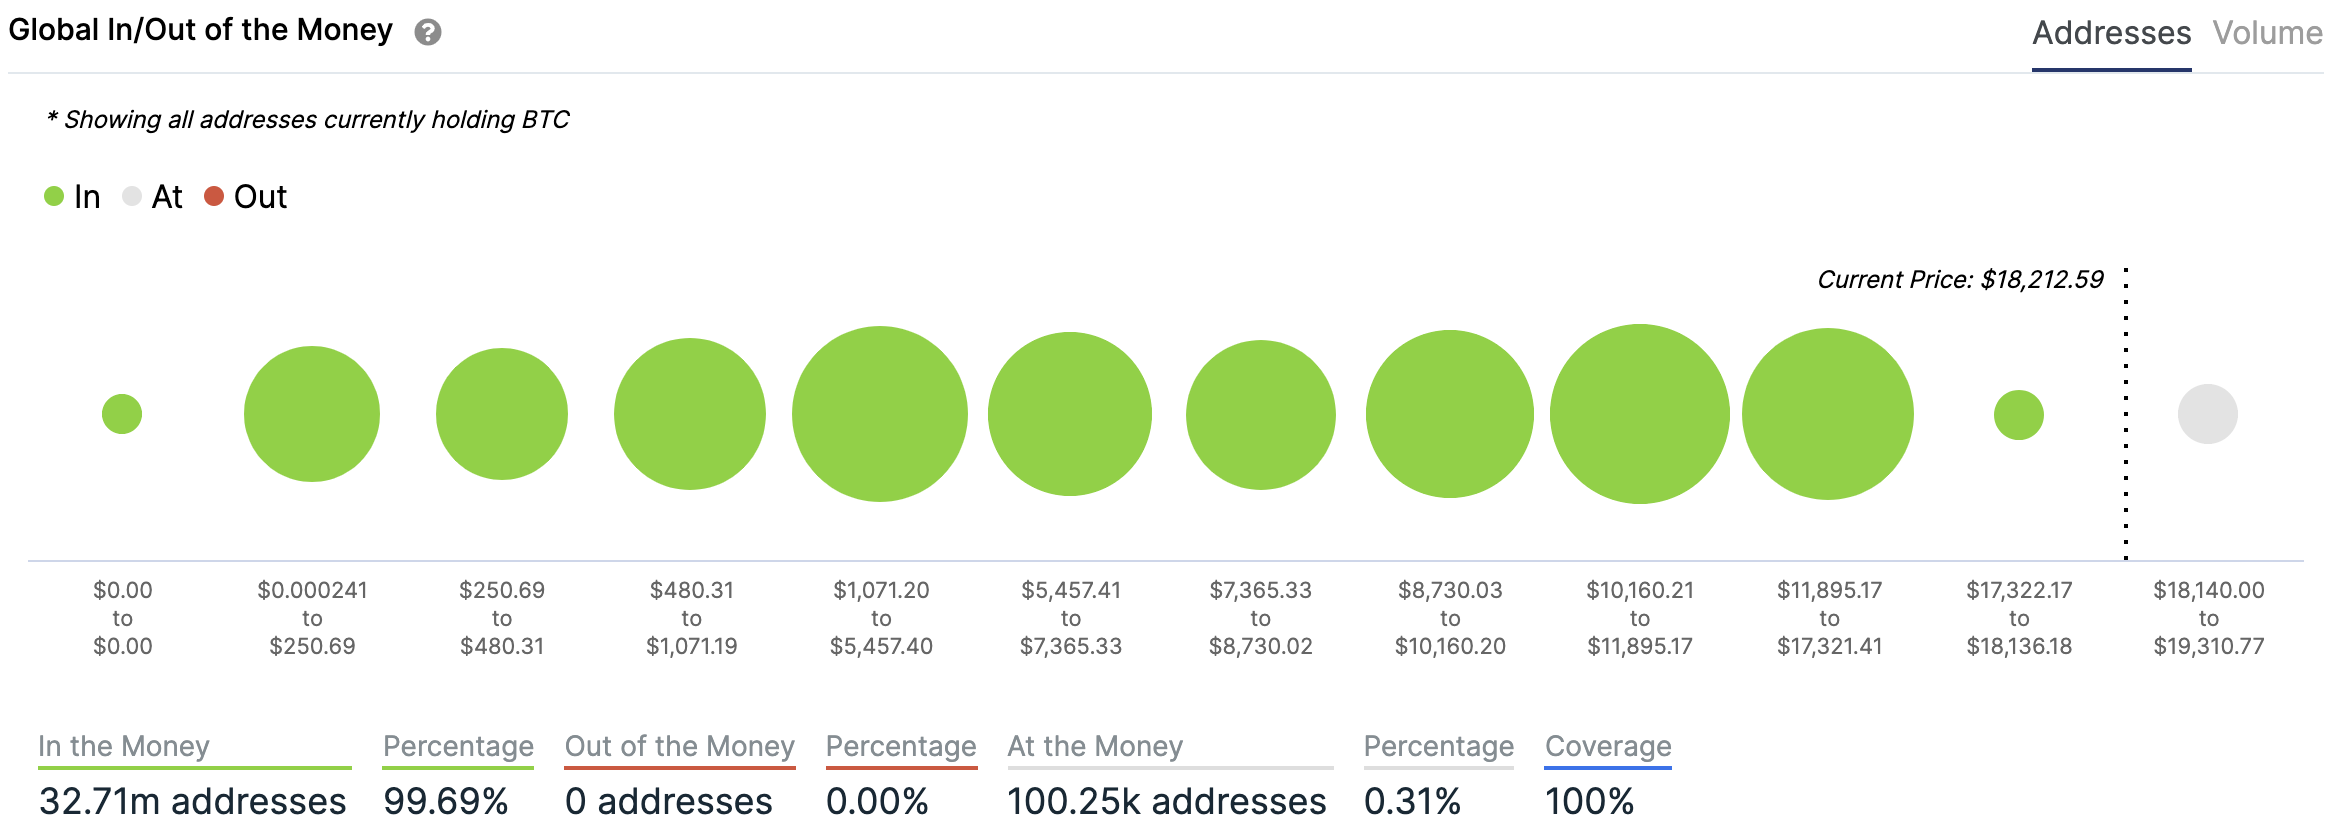
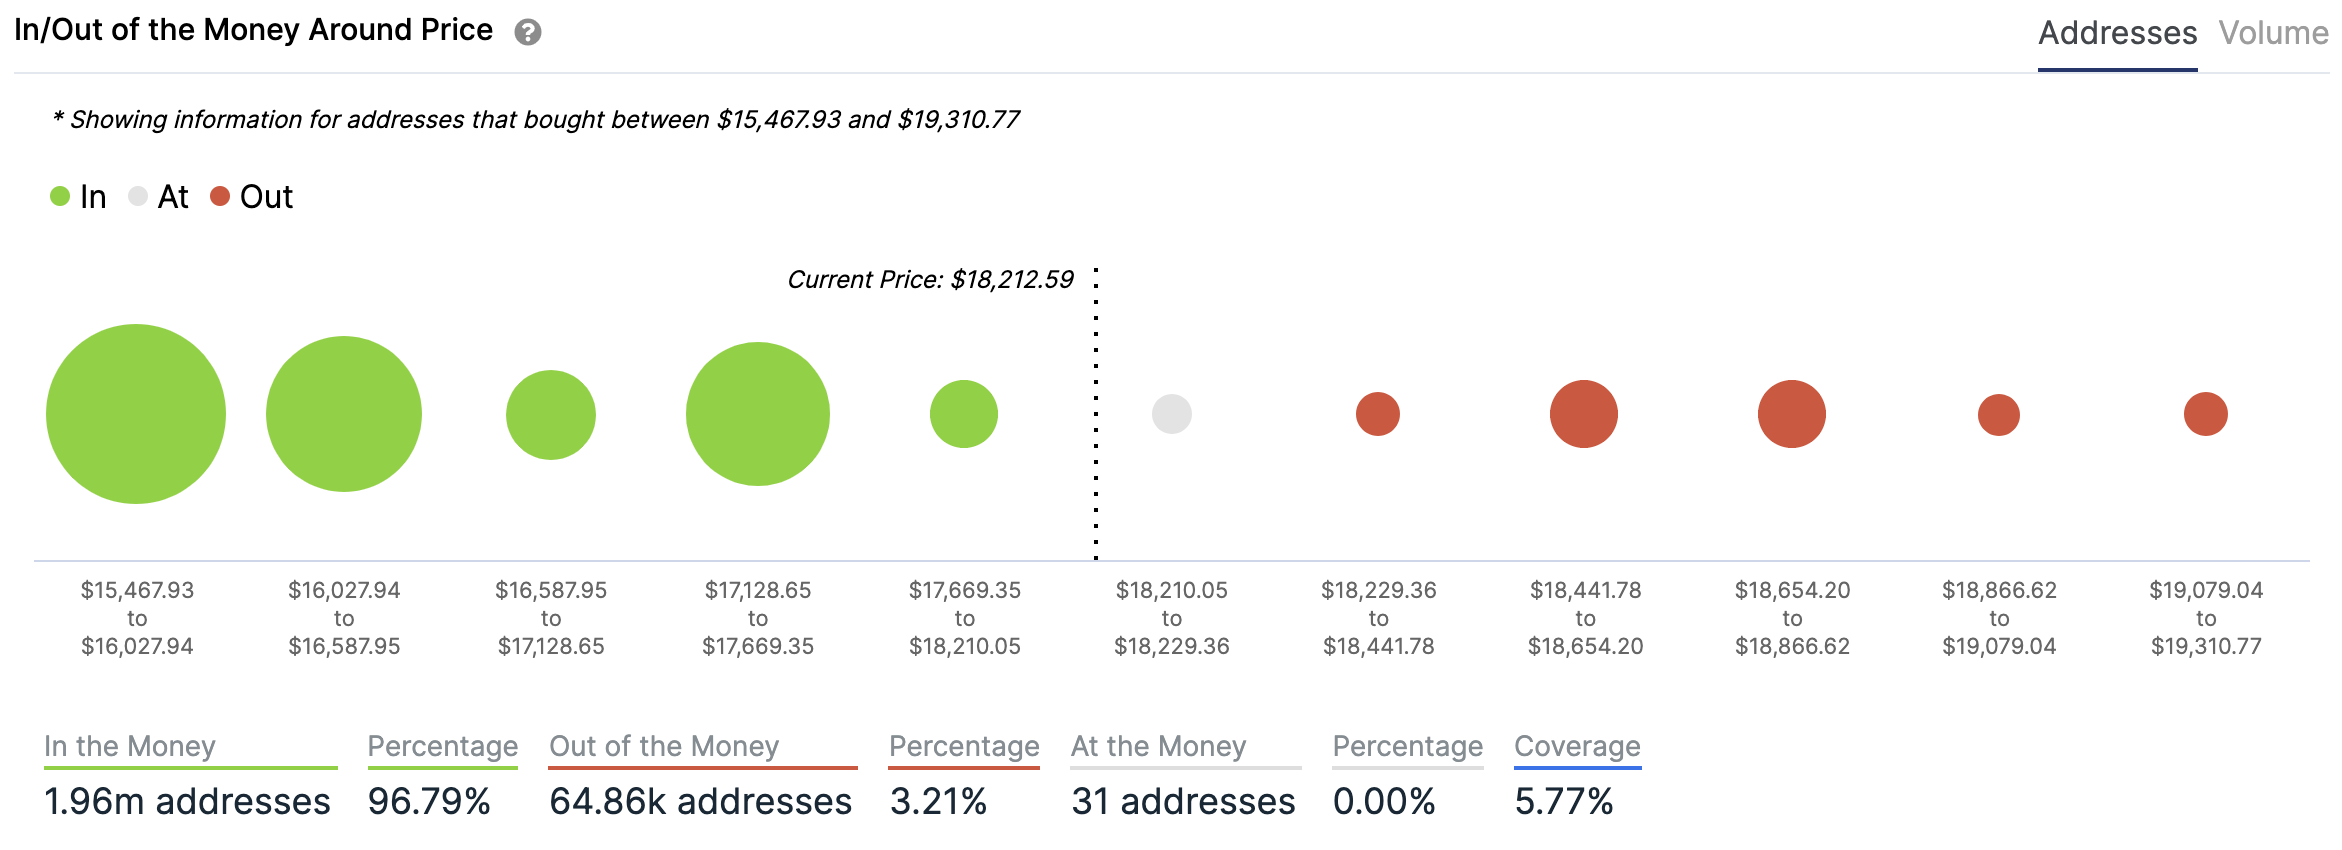
In/Out of the money
For any address with a balance of tokens, ITB identifies the average price (cost) at which those tokens were purchased and compares it with the current price. If the current price is higher than average cost, address is ‘In the Money’. If the current price is lower than the average cost, the address is ‘Out of the Money’.
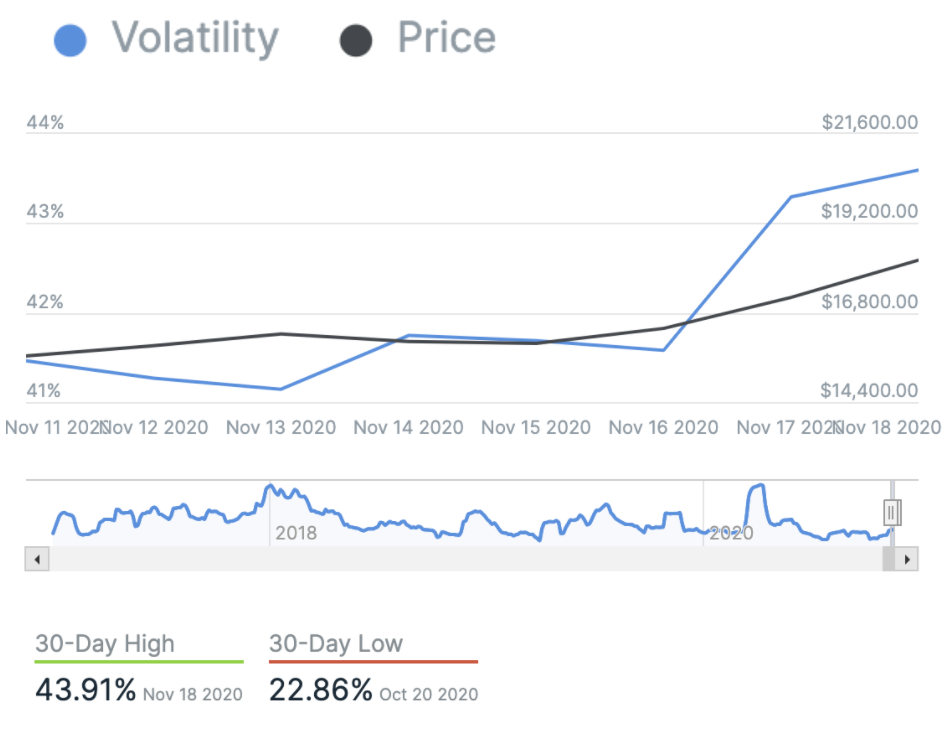
Volatility
Annualised price volatility using 365 days.
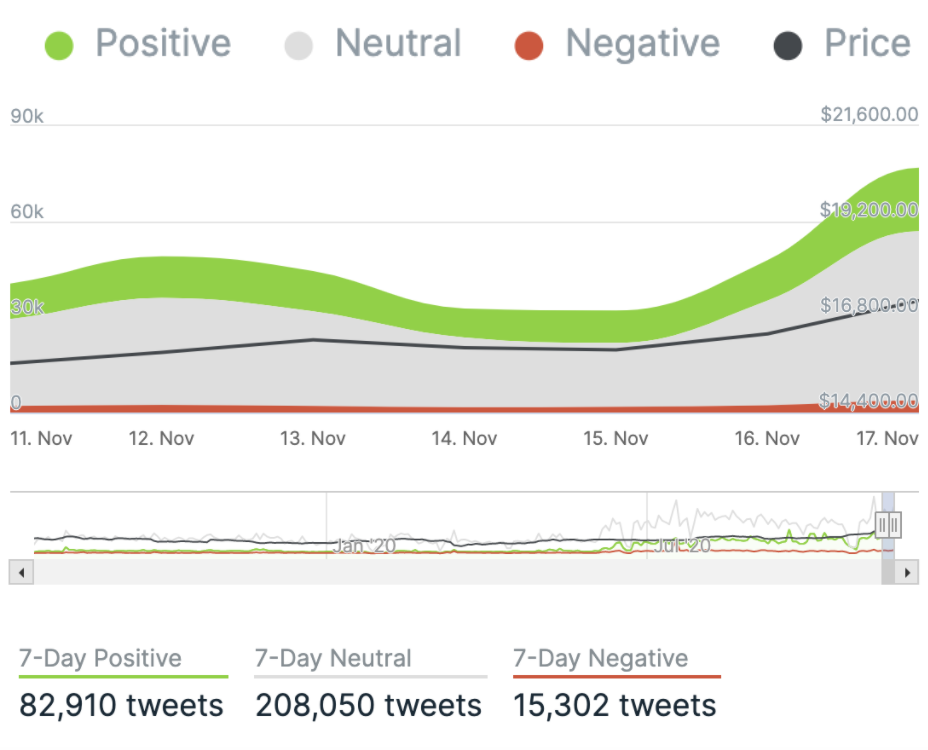
Twitter sentiment
Yesterday, there were 19,923 tweets sent with a positive connotation towards bitcoin, 53,179 with a neutral connotation, and 3,808 were negative.
Bitcoin’s market dominance
Bitcoin’s market dominance stands at 67.42. Its lowest recorded dominance was 37.09 on 8 January, 2018.
Relative Strength Index (RSI)
The daily RSI is currently 82.04. Values of 70 or above indicate that an asset is becoming overbought and may be primed for a trend reversal or experience a correction in price – an RSI reading of 30 or below indicates an oversold or undervalued condition.
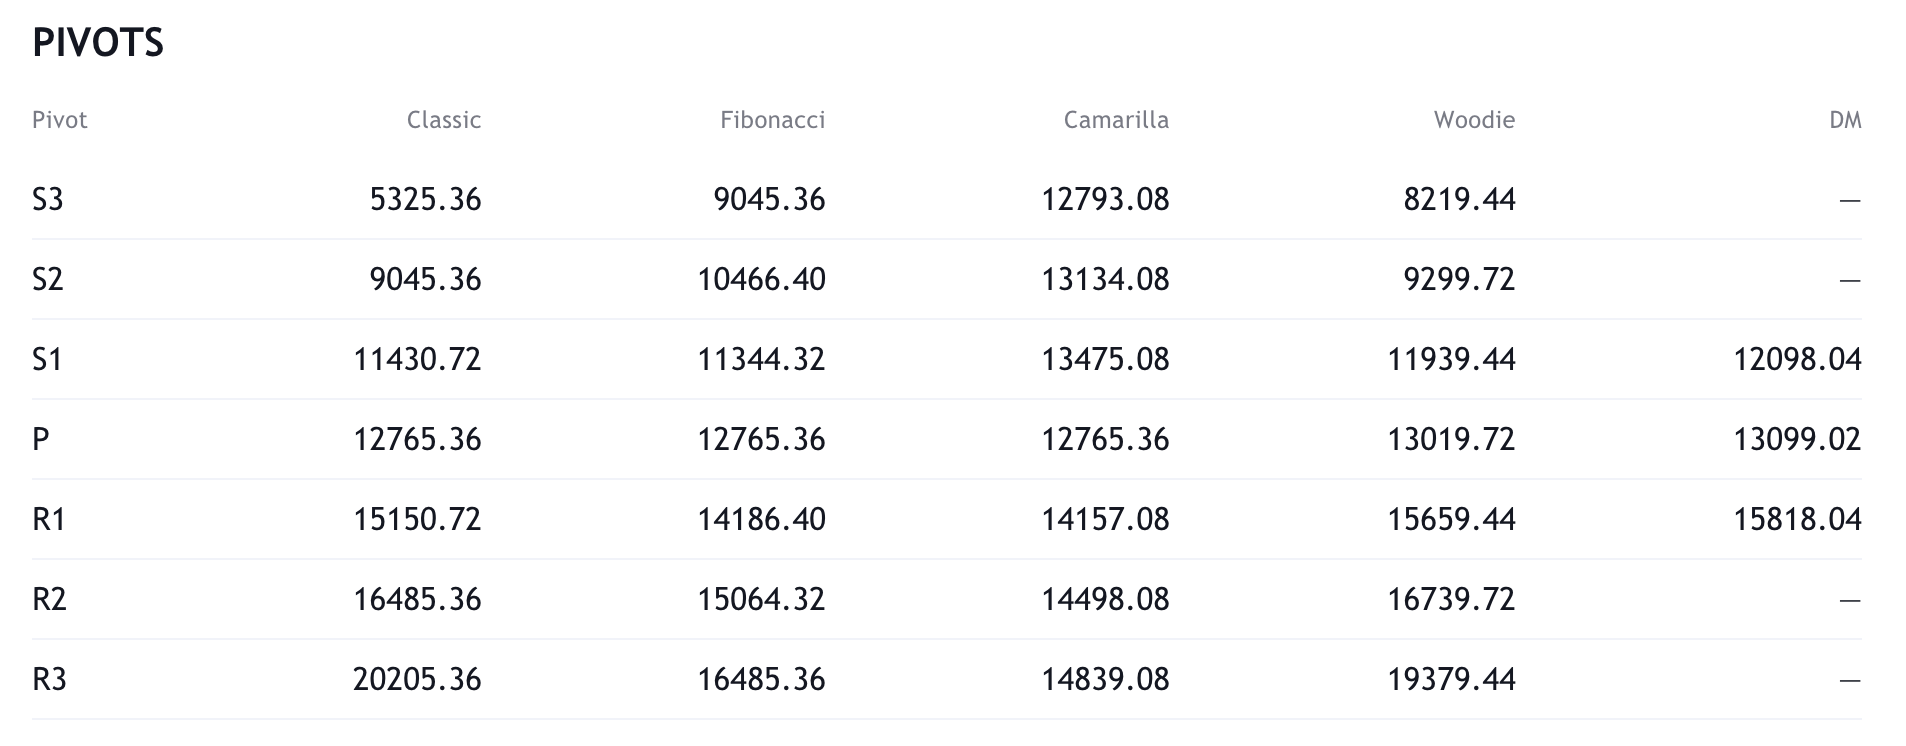
Resistance and support
What they said yesterday…
thank you for the advice. i bought some anyway. https://t.co/mhZiVoN6vy pic.twitter.com/XeU1KkfuXy
— Maisie Williams (@Maisie_Williams) November 17, 2020
The media has completely missed the recent #Bitcoin bull run. This is the problem with a centralized media complex, it chooses the narrative it wants, not the one that’s actually happening. Time to decentralize.
— Tyler Winklevoss (@tyler) November 17, 2020
Ricardo Salinas Pliego, billionaire founder of Mexico’s Grupo Salinas, has said 10% of his liquid portfolio is now tied up in bitcoin.@RicardoBSalinas
Report by @sebsinclair1989 https://t.co/ppk216lOYt
— CoinDesk (@CoinDesk) November 18, 2020
HAHAHHA WHAT IS GOING ON!!
BITCOIN MOON!!— Ivan on Tech (@IvanOnTech) November 17, 2020
What other data points would you like to see covered in our Daily Report? Let us know on Twitter.
Did you find this useful?