Discover
 Help Centre
 Status
 Company
 Careers
 Press
PressDaily market update: “Bitcoin is one of the best performing assets of 2020”

It’s October and while we’re not really anywhere near the end of the year, apparently some on Twitter are already noting that bitcoin is one of the best performing assets of 2020. It’s probably a bit premature to start gloating and getting overexcited, but WAHOO WHAT A TIME TO BE ALIVE!
That being said, here’s the latest rundown of market conditions today. If you’re new to the world of crypto trading, don’t forget to take a look through our beginner’s guide to crypto trading series, featuring in-depth explorations of common strategies, market analysis techniques, and more.
The content of this article is for information purposes only and is not investment advice or any form of recommendation or invitation. Luno always advises you to obtain your own independent financial advice before investing or trading in cryptocurrency.
All information is correct as of 11:00am BST.
Bitcoin price
We closed yesterday, 4 October, 2020, at a price of $10,684.43 – with a daily high of $10,700.79 and a low of $10,531.34.
On 4 October, 2019, the closing price was $8,205.94. On 4 October, 2018, it was $6,576.69 and the same date in 2017 was $4,229.36.
We’re 46.81% below bitcoin‘s all-time high of $20,089 (17 December 2017).
Bitcoin volume
The volume traded yesterday was $19,385,191,766 – up from $17,546,792,792 the day before.
Market capitalisation
Bitcoin’s market capitalisation as of yesterday was $199,971,325,817, down from $197,748,815,075 the day before. To put that into context, Jeff Bezos is currently worth $175.3 billion. This means he can only afford to buy 87.66% of all bitcoin. Bad start to the week for Jeff. Only uphill from here!
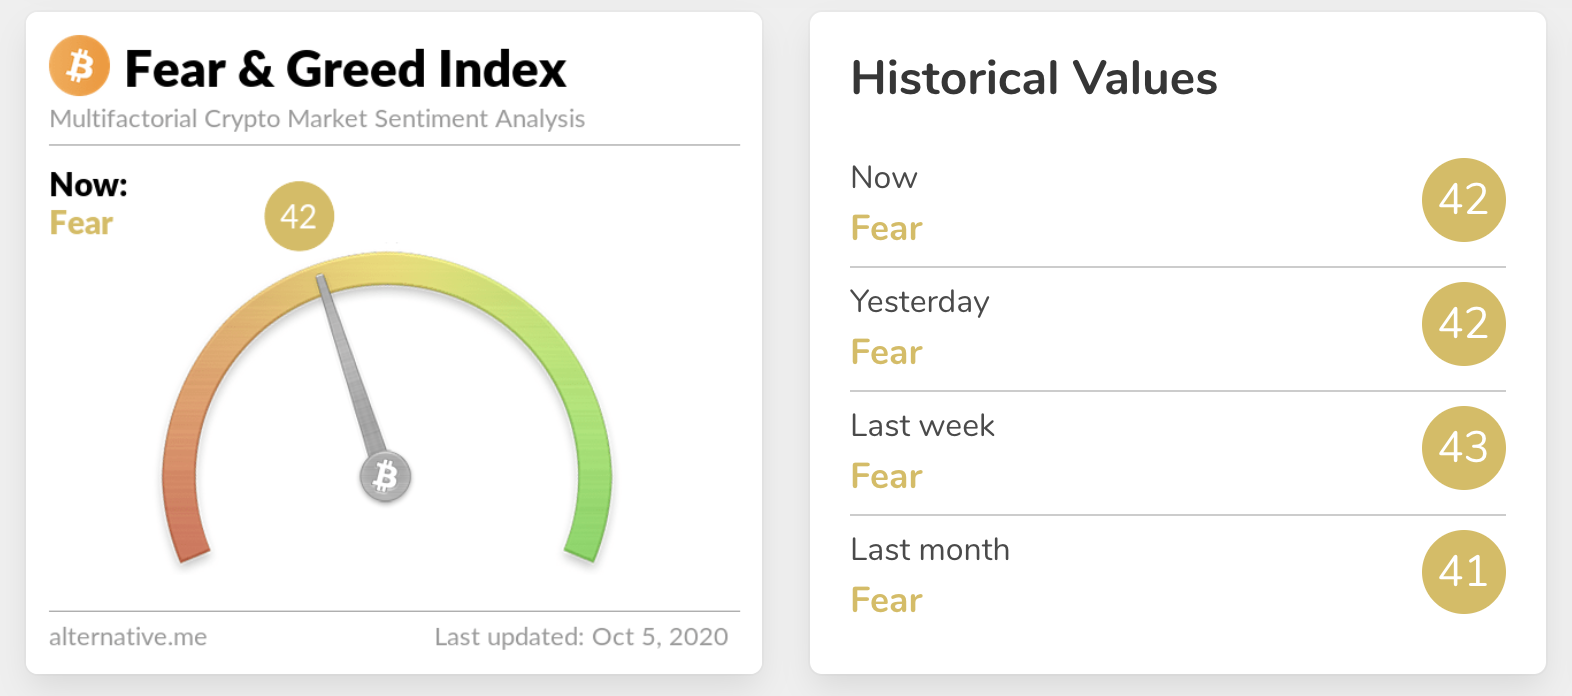
Fear and Greed Index
Sentiment is back down at 42. The Fear and Greed index has now only exceeded 50 once in the past 30 days. Extreme fear can be a sign that investors are too worried, which could be a buying opportunity. When Investors are getting too greedy, that means the market may be due for a correction. Are we set for a big move?
Global In/Out of the money
For any address with a balance of tokens, ITB identifies the average price (cost) at which those tokens were purchased and compares it with the current price. If the current price is higher than average cost, address is ‘In the Money’. If the current price is lower than the average cost, the address is ‘Out of the Money’.
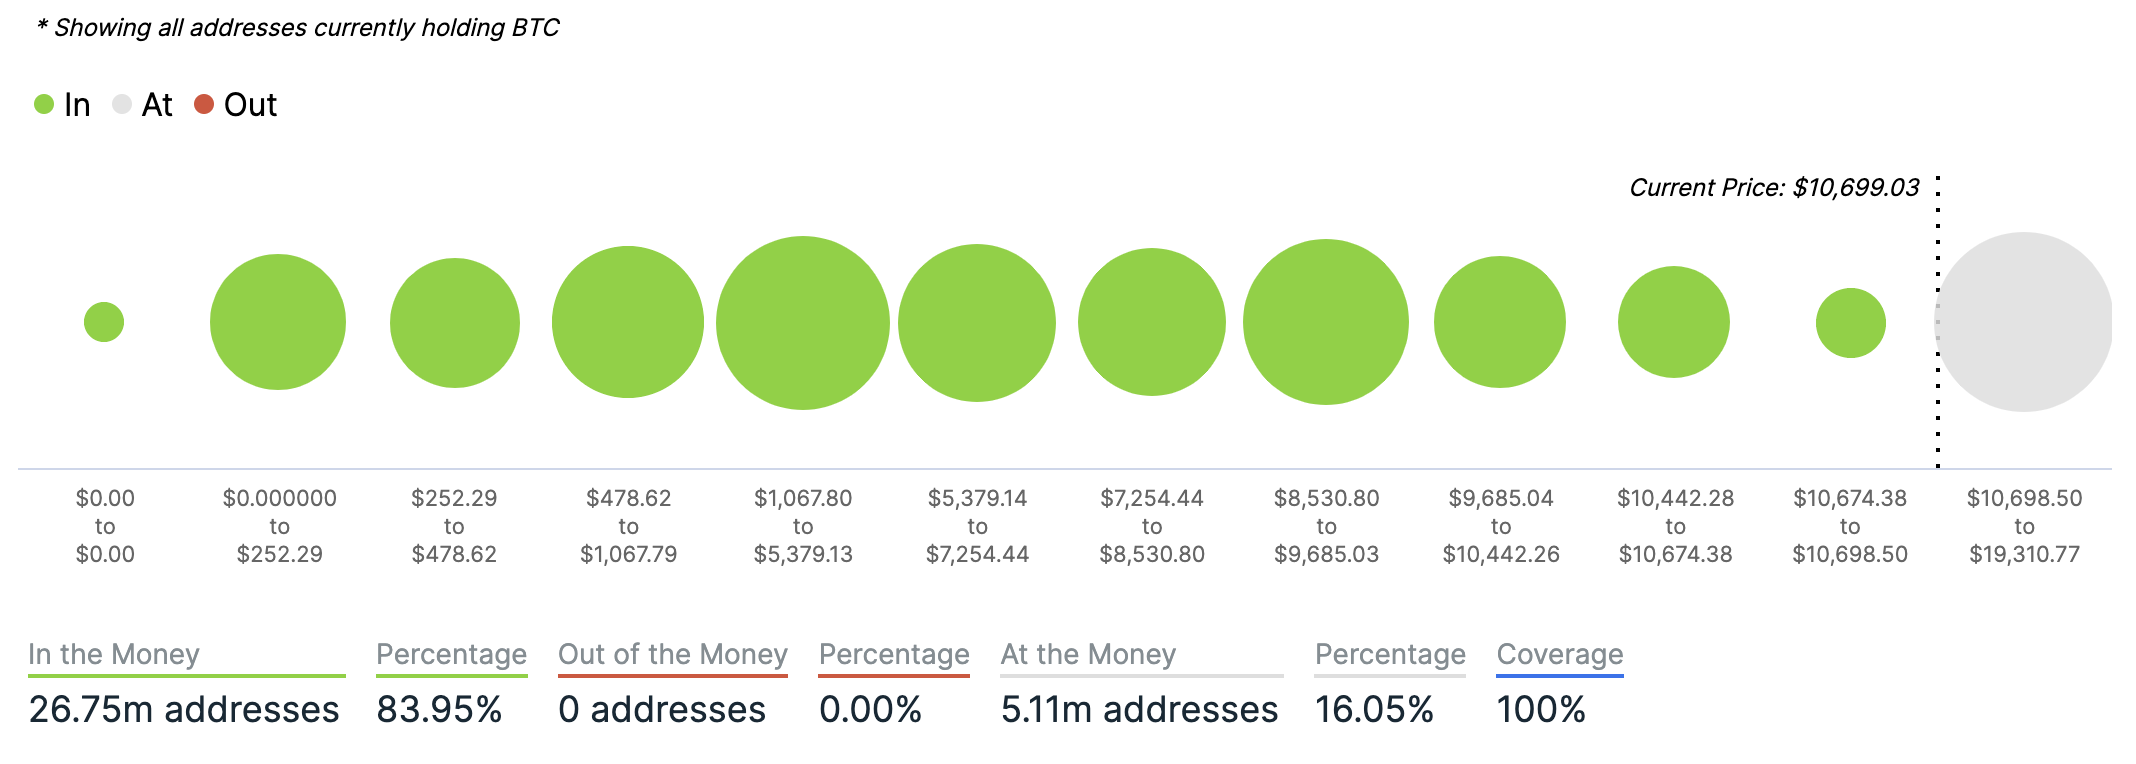
Chart courtesy of IntotheBlock.com
Volatility
Annualised price volatility using 365 days.
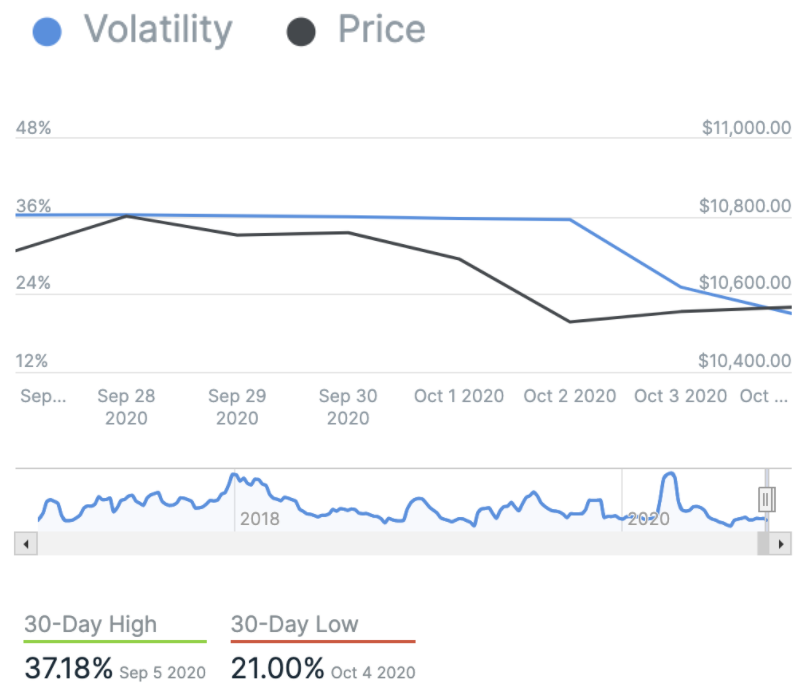
Chart courtesy of IntotheBlock.com
Bitcoin’s market dominance
Bitcoin’s market dominance stands at 59.50. Its lowest recorded dominance was 37.09 on 8 January, 2018.
Relative Strength Index (RSI)
The daily RSI is currently 49.15. Values of 70 or above indicate that an asset is becoming overbought and may be primed for a trend reversal or experience correction in price – an RSI reading of 30 or below indicates an oversold or undervalued condition.
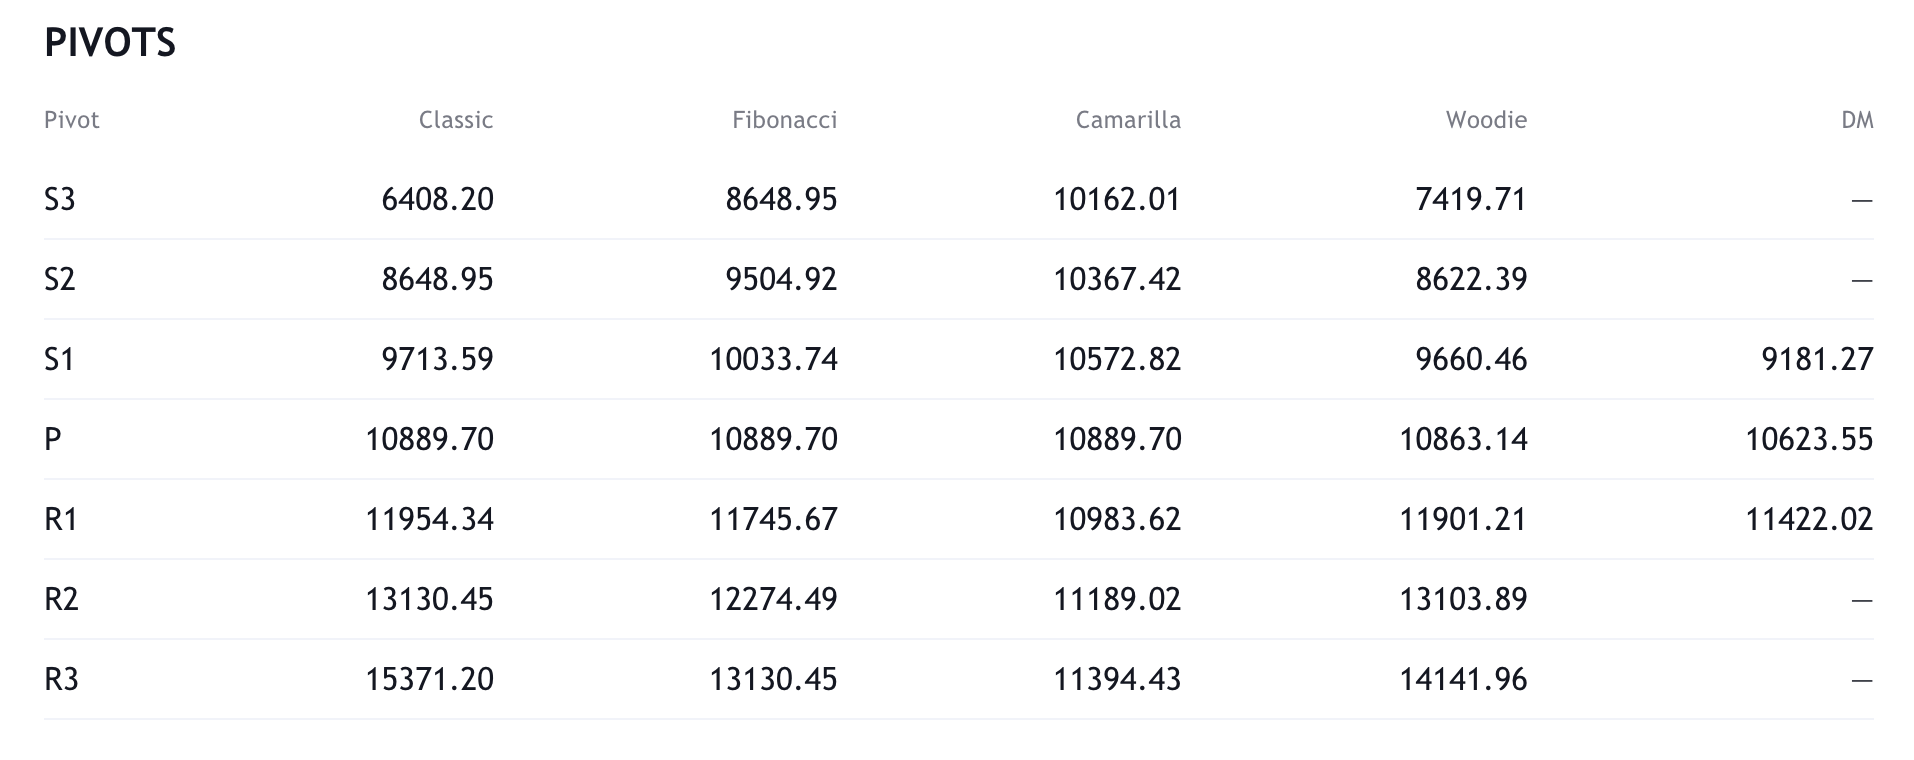
Resistance and support
What they said yesterday…
Bitcoin is one of the best performing assets of 2020. pic.twitter.com/lPzHarmUzP
— Dan Held (@danheld) October 4, 2020
Positive inflation drains the energy from your life. Negative interest is an attempt to stop the flow of time. Channel your energy into #Bitcoin and move forward toward the future you deserve.
— Michael Saylor (@michael_saylor) October 4, 2020
Longest #Bitcoin streak ending the day above $10,000 still going strong despite this last week.
Today will be day 69…
— Danny Scott (@CoinCornerDanny) October 4, 2020
Bitcoin use increases in Egypt as the country deals with an economic recession and surging unemployment https://t.co/iU2MPZllWg
— Cointelegraph (@Cointelegraph) October 4, 2020
What other data points would you like to see covered in our Daily Report? Let us know on Twitter.
Did you find this useful?