Discover
 Help Centre
 Status
 Company
 Careers
 Press
PressDaily market update: Bitcoin sentiment remains in fear, but Bloomberg bullish

The bitcoin market is still trading in that narrow corridor between $10,600 and $10,800, and with both volume and sentiment staying low, what happens next is up in there. It’s good to see some major players are still bullish though, with a Bloomberg analysis yesterday noting that bitcoin has had a “tendency of adding zeroes to its price” and predicting a price of $100,000 by 2025. Do you think they’re right? Let us know on Twitter.
Here’s today’s market breakdown. We’ve got a couple of new metrics for you, courtesy of IntoTheBlock.com. They’re a good bunch – check them out if you want to take a deeper dive into their huge array of indicators. If you’re new to the world of crypto trading, don’t forget to take a look through our beginner’s guide to crypto trading series, featuring in-depth explorations of common strategies, market analysis techniques, and more.
The content of this article is for information purposes only and is not investment advice or any form of recommendation or invitation. Luno always advises you to obtain your own independent financial advice before investing or trading in cryptocurrency.
All information is correct as of 07:30am BST.
Bitcoin price
We closed yesterday, 5 October, 2020, at a price of $10,804.00, with a daily high of $10,804.00 and a low of $10,646.44. That’s the highest closing price since 29 September.
On 5 October, 2019, the closing price was $8,151.50. On 4 October, 2018, it was $6,622.48 and the same date in 2017 was $4,328.41.
We’re 46.22% below bitcoin‘s all-time high of $20,089 (17 December 2017).
Bitcoin volume
The volume traded yesterday was $19,385,191,766 – up from $17,546,792,792 the day before.
Market capitalisation
Bitcoin’s market capitalisation as of yesterday was $199,971,325,817, up from $197,748,815,075 the day before. To put that into context, Jeff Bezos is currently worth $175.3 billion. This means he can only afford to buy 87.66% of all bitcoin. Not doing too well this week, Jeff.
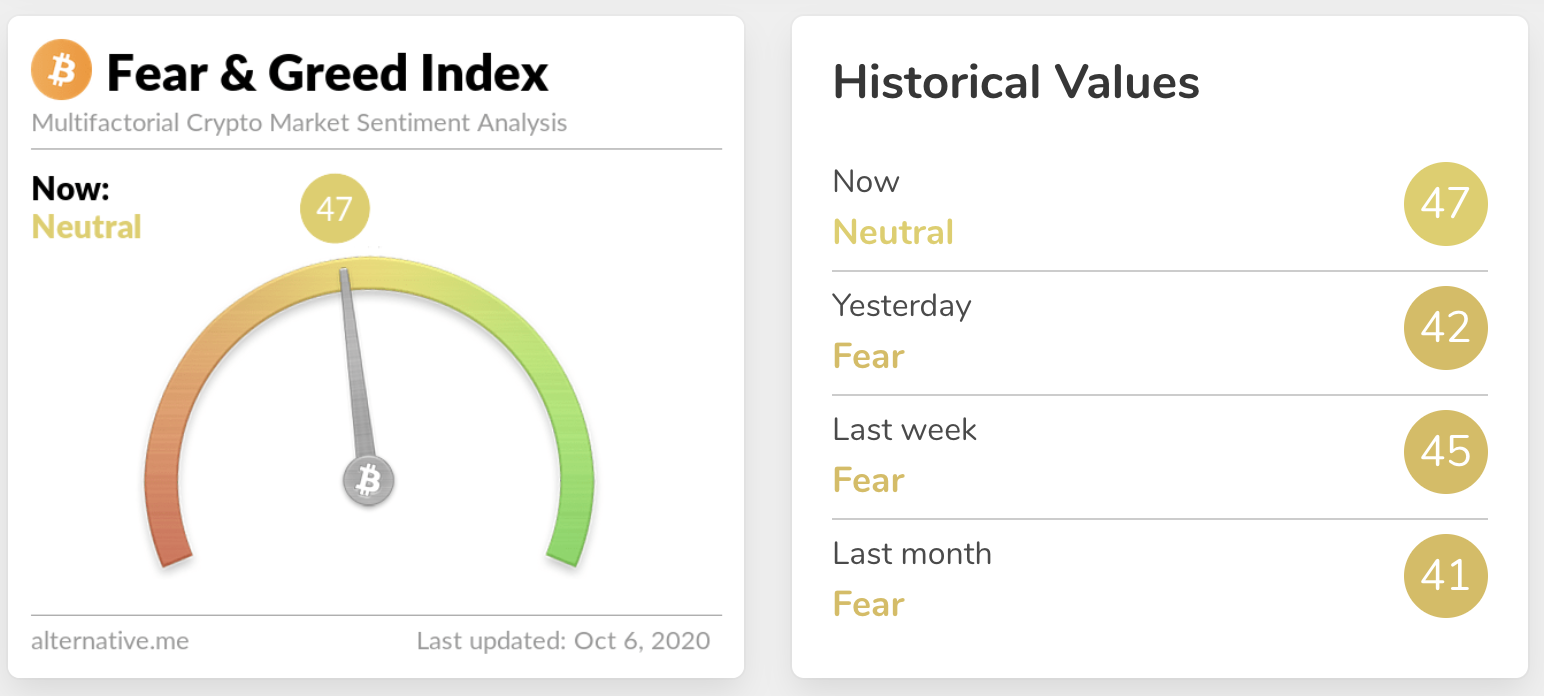
Fear and Greed Index
Sentiment is at 47 – up from 42 yesterday. The Fear and Greed index is still not tilting into Greed – will October be a second month characterised by fear? Extreme fear can be a sign that investors are too worried, which could be a buying opportunity. When Investors are getting too greedy, that means the market may be due for a correction. Are we set for a big move?
Twitter sentiment
Yesterday, there were 9,071 tweets sent with a positive connotation towards bitcoin, 19,279 with a neutral connotation, and 1,483 were negative.
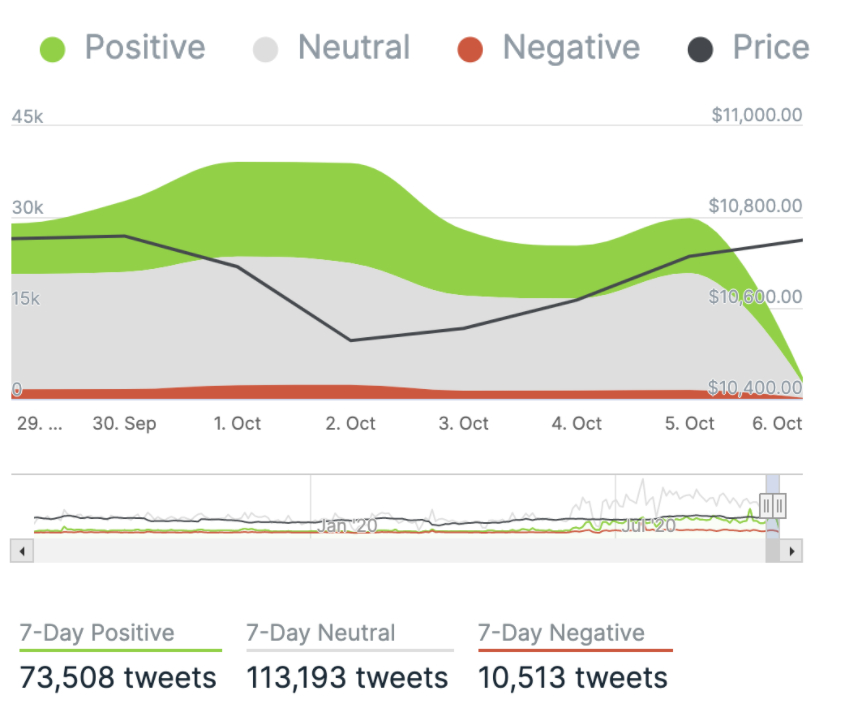
Chart courtesy of IntotheBlock.com
Global In/Out of the money
For any address with a balance of tokens, ITB identifies the average price (cost) at which those tokens were purchased and compares it with the current price. If the current price is higher than average cost, address is ‘In the Money’. If the current price is lower than the average cost, the address is ‘Out of the Money’.
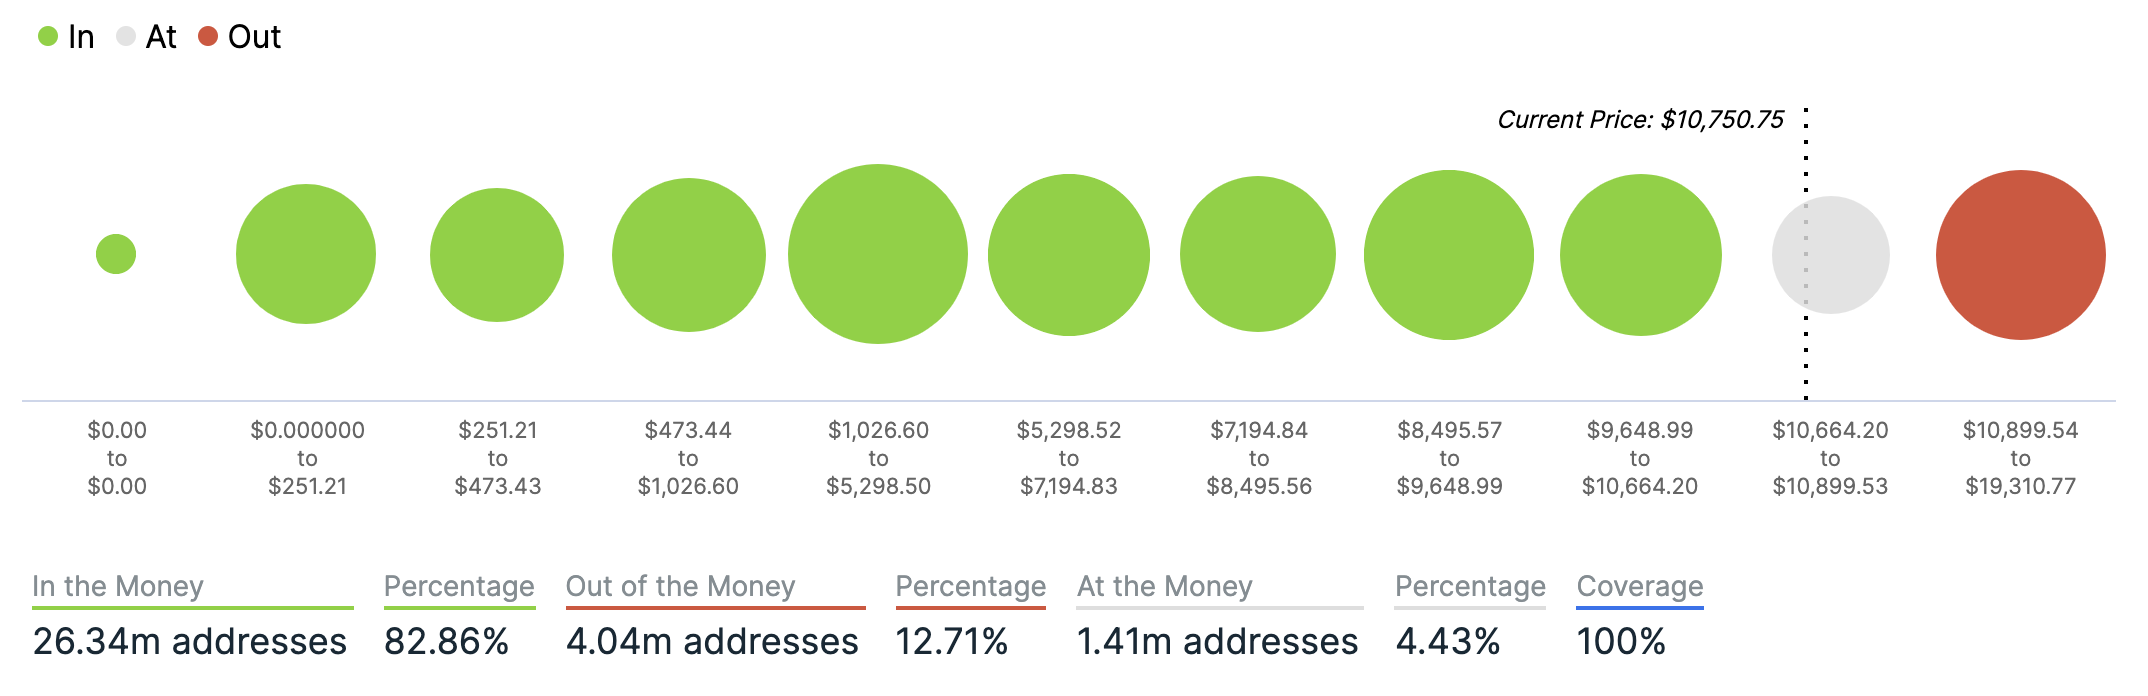
Chart courtesy of IntotheBlock.com
Volatility
Annualised price volatility using 365 days.
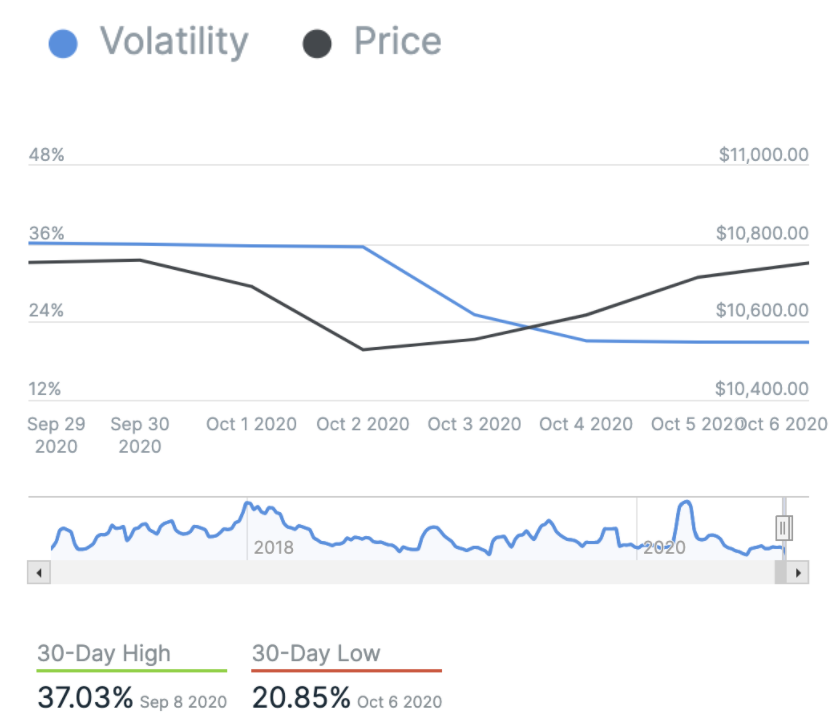
Chart courtesy of IntotheBlock.com
Bitcoin’s market dominance
Bitcoin’s market dominance stands at 59.55. Its lowest recorded dominance was 37.09 on 8 January, 2018.
Relative Strength Index (RSI)
The daily RSI is currently 50.12. Values of 70 or above indicate that an asset is becoming overbought and may be primed for a trend reversal or experience correction in price – an RSI reading of 30 or below indicates an oversold or undervalued condition.
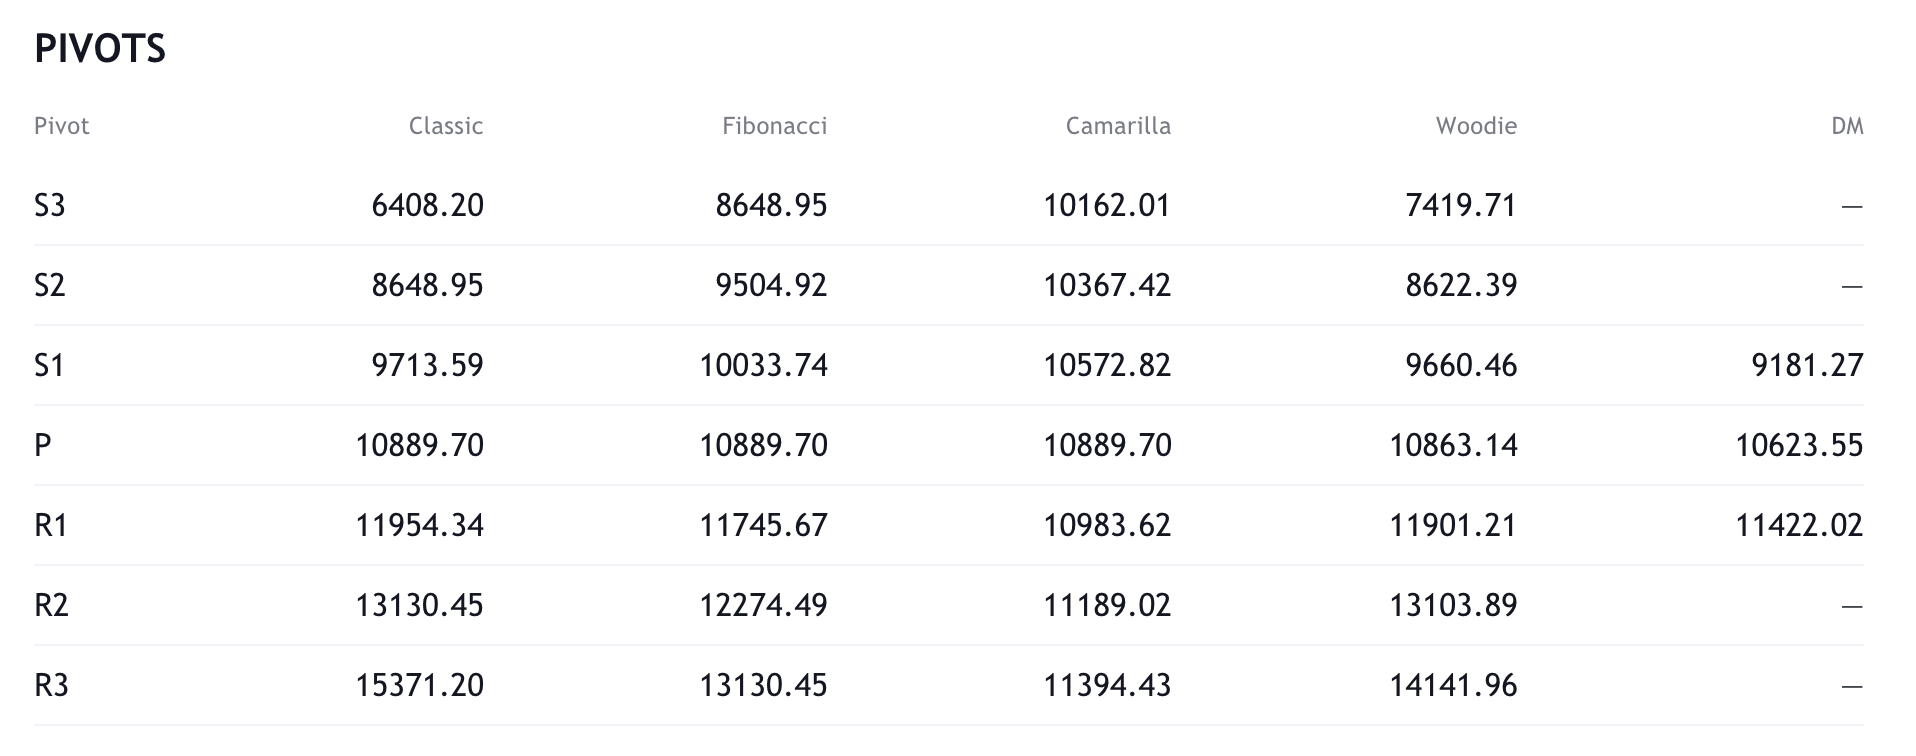
Resistance and support
What they said yesterday…
1/ New #bitcoin addresses were absolutely off the charts last week.
The backstory is bullish and intriguing — a unique view on a new bull market catalyst.
I’m about to break this down ?#BTC pic.twitter.com/GPZ1e3mzAr
— Cole Garner (@ColeGarnerBTC) October 5, 2020
Conservative. I’d say #bitcoin likely sees $1trillion market cap within 2years, probably sooner. $1trillion is about BTC $50k. https://t.co/LJeq53DXgM
— Adam Back (@adam3us) October 5, 2020
The @SEC_News is suing @officialmcafee on charges he pumped crypto tokens he had a personal stake in or was paid to boost. @realDannyNelson reports https://t.co/3bq5VMWCTH
— CoinDesk (@CoinDesk) October 5, 2020
Wow!
First time I can recall #Bloomberg analyst super bullish #Bitcoin forecast with real analysis.
Surprising from mainstream and traditional source.
14k possible this year, 100k by 2025.
Lengthy report provides 10+ reasons for bullish call.
Maybe @michael_saylor motivated. pic.twitter.com/BUXOraQEil
— Dan Tapiero (@DTAPCAP) October 5, 2020
What other data points would you like to see covered in our Daily Report? Let us know on Twitter.
Did you find this useful?