Discover
 Help Centre
 Status
 Company
 Careers
 Press
PressDaily market update: Will bitcoin break $20k today?

***14:00 GMT UPDATE: Bitcoin breaks $20k, soaring to historical all-time high***
The start of last week saw the prices of both BTC and ETH tumble, but any bears hoping this was the beginning of a sustained downward trend look to have been left disappointed. Bitcoin is now back above the price it was at the start of the month and there’s a lot of excited chatter in crypto knitting circles. What will happen when we finally break through that pesky $19,600 resistance that’s been knocking us back lately? Onward to $20,000? Be warned: celebrations could get weird.

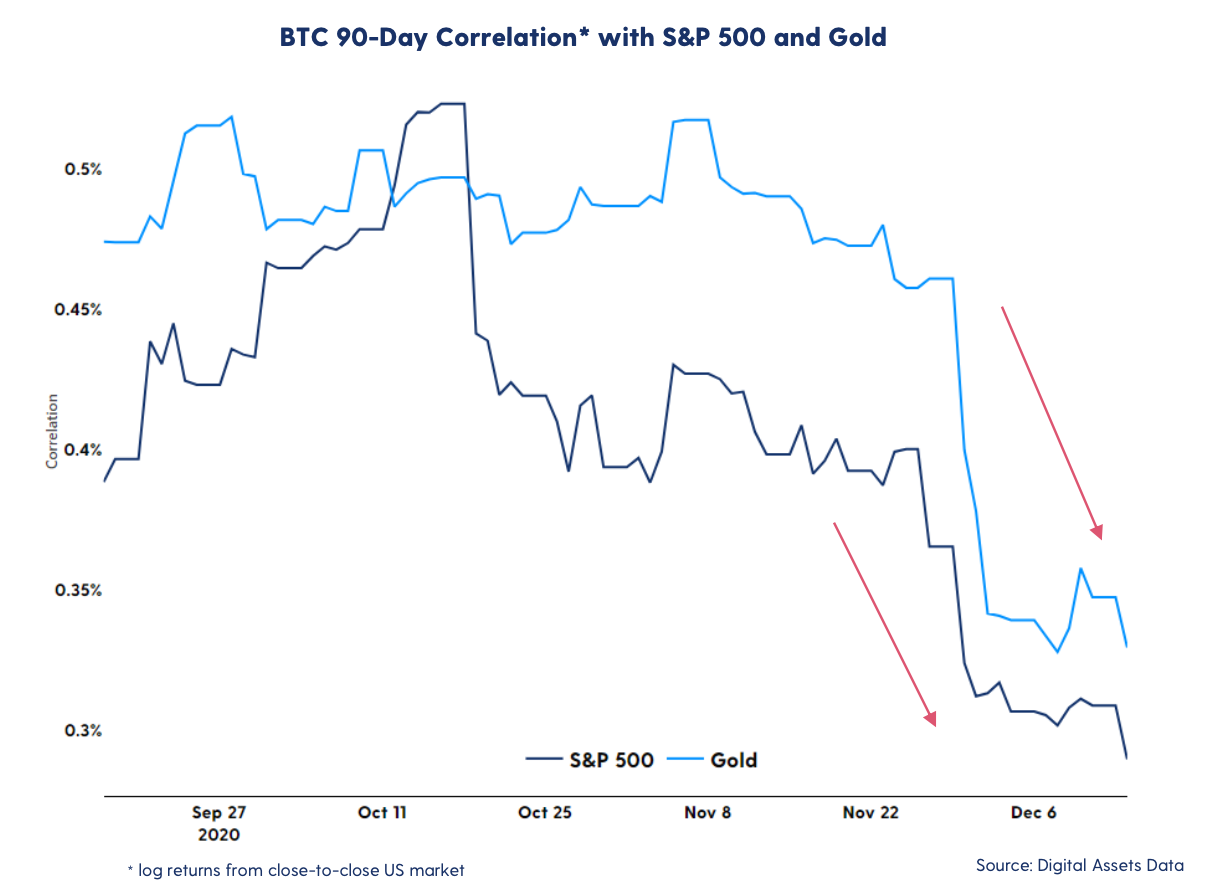
Zooming out, the correlation between bitcoin, the stock market and other asset classes appears to be decreasing. The correlation with the S&P 500 has been decreasing steadily since the beginning of October, with Bitcoin’s magnificent returns over the past months having seen it decouple from most assets. The correlation with the S&P is now the lowest since the March crash. Good news.
Here’s all the latest from the crypto and bitcoin markets. Fun stuff. Interpret it how you please. The content of this article is for information purposes only and is not investment advice or any form of recommendation or invitation. Luno always advises you to obtain your own independent financial advice before investing or trading in cryptocurrency.
If you’re new to the world of crypto, take a look through our beginner’s guide to crypto trading series to get a better idea of all these indicators, starring in-depth explorations of common strategies, market analysis techniques, and more.
All information is correct as of 09.30am GMT.
Crypto at a glance
Total Crypto Market Cap: $506,940,041,161
| Price | Market cap | Volume | Circulating Supply | |
| Bitcoin | $19,471.39 | $361.07b | $24,958,985,490 | 18,572,456 BTC |
| Ethereum | $586.60 | $66.65b | $8,464,043,633 | 113,853,065 ETH |
| XRP | $0.45 | $20.45b | $10,217,654,839 | 45,404,028,640 XRP |
| Litecoin | $80.40 | $5.43b | $3,429,890,734 | 66,098,948 LTC |
| Bitcoin Cash | $285.32 | $5.32b | $2,858,552,469 | 18,600,863 BCH |
What bitcoin did yesterday
We closed yesterday, 15 December, 2020, at a price of $19,417.08 – up from $19,246.64 the day before. The price has now closed over $18,000 for 17 consecutive days.
The daily high yesterday was $19,525.01 and the daily low was $19,079.84. That’s the highest daily high since Wednesday of last week and the highest daily low in Bitcoin’s history. This time last year, the price of bitcoin closed the day at $7,152.30 and in 2018 it was $3,236.76.
We’re 3.35% below bitcoin‘s all-time high on CoinMarketCap of $20,089 (17 December 2017).
As of today, buying bitcoin has been profitable for…
99.7% of all days since 2013-04-28.
MicroStrategy has now made…
MicroStrategy now holds 40,824 bitcoins worth $797 million. They have now made $322 million on the cumulative $475 million they invested in Bitcoin.
Market capitalisation
Bitcoin’s market capitalisation is currently $361.07 billion, up from $357,432,550,020 yesterday. To put that into context, JP Morgan’s market cap is $366.7 billion and Jeff Bezos is currently worth $182 billion. That means he could only afford to buy half of all bitcoin. Better luck next time, Jeff.
Bitcoin volume
The volume traded over the last 24 hours was $26,741,982,541, up from $22,473,997,681 yesterday. High volumes can indicate that a significant price movement has stronger support and is more likely to be sustained.
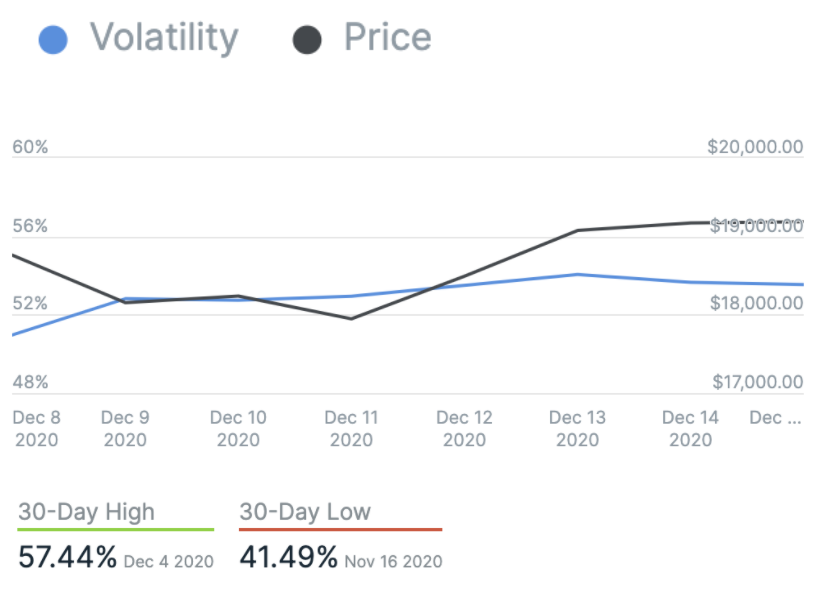
Volatility
The price volatility of bitcoin over the last 30 days is 53.13%.
Charts provided by IntoTheBlock.com
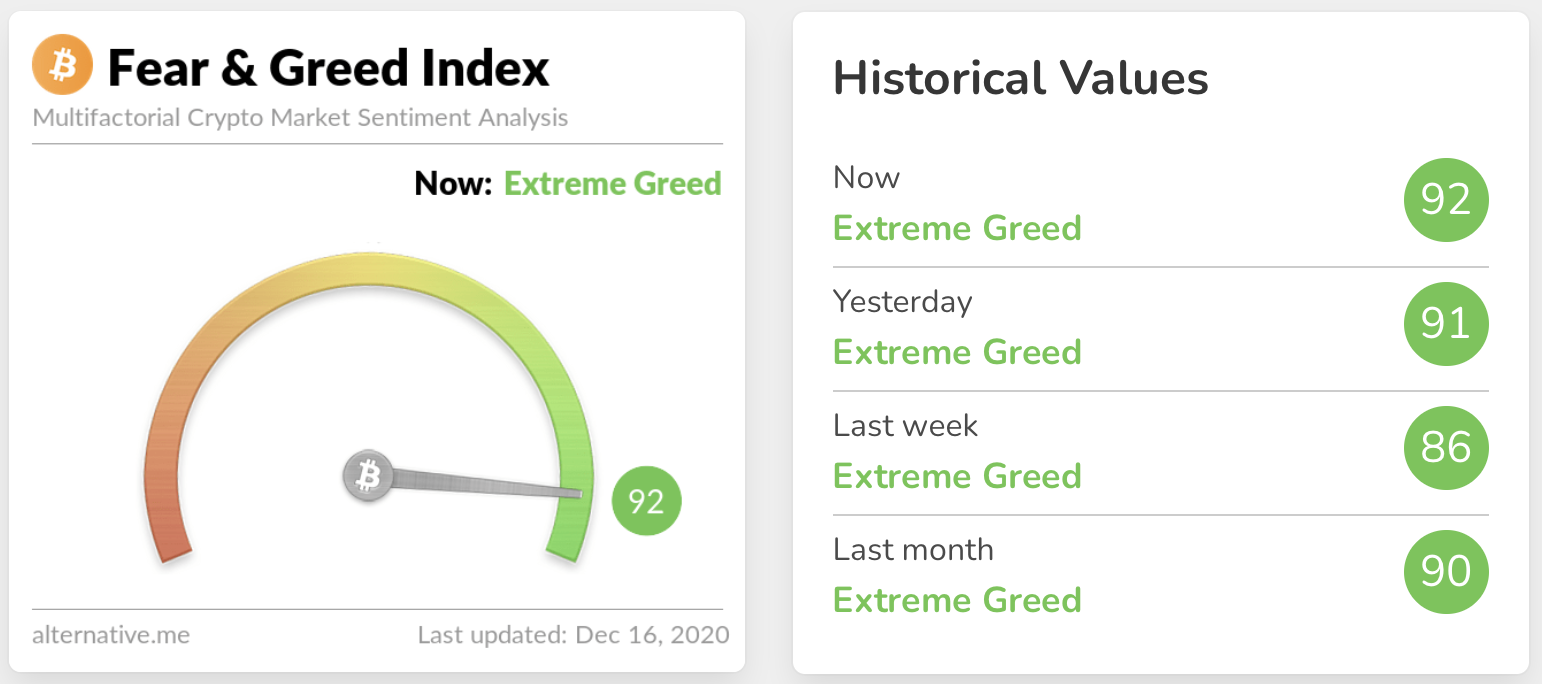
Fear and Greed Index
The sentiment remains in Extreme Greed territory at 92, up from 91 yesterday. The last time the sentiment was lower than Extreme Greed was 6 November, 2020. It’s important to remember that the index doesn’t stay this high very often and a correction could be on the cards. It’s also important to remember that we’ve been saying that for a while so it’s really anyone’s guess at this point.
Bitcoin’s market dominance
Bitcoin’s market dominance stands at 64.89. Its lowest recorded dominance was 37.09 on 8 January, 2018.
Relative Strength Index (RSI)
The daily RSI is currently 60.76. Values of 70 or above indicate that an asset is becoming overbought and may be primed for a trend reversal or experience a correction in price – an RSI reading of 30 or below indicates an oversold or undervalued condition.
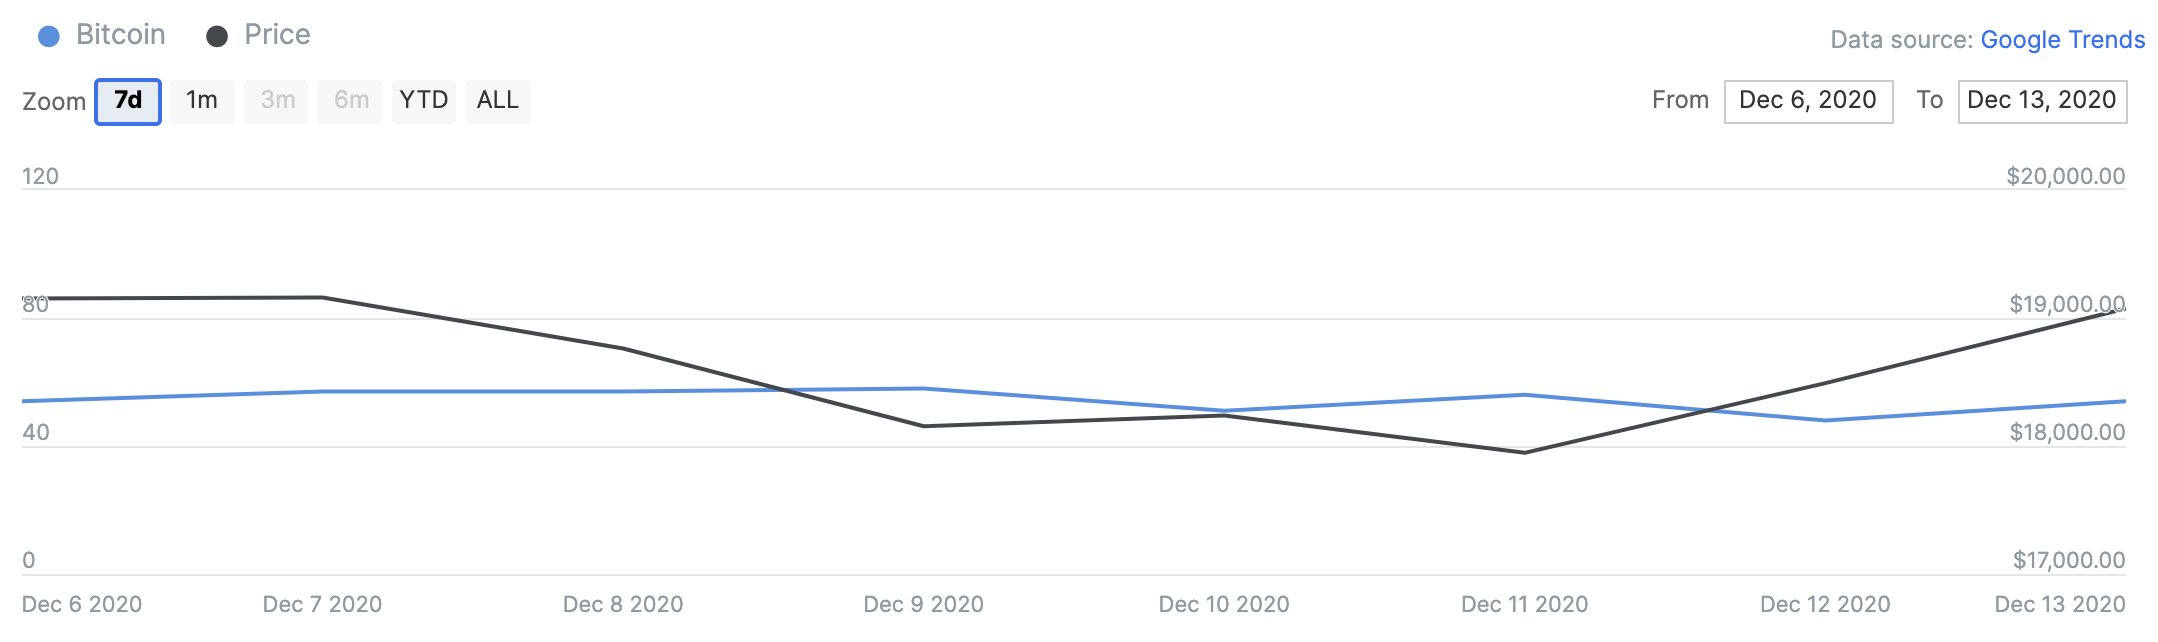
Google trends
The trend in Google searches over the last 90 days. Google shows this chart on a relative basis with a max score of 100 on the day that had the most Google searches for that keyword. Today’s score is 54.
Charts provided by IntoTheBlock.com
Convince your Nan cutout of the day
Bitcoin moves nearly half a million dollars in value around the globe permissionlessly every second. It’s all about value transacted per second and a new financial paradigm – Samson Mow, Twitter
Twitter sentiment
Yesterday, there were 10,887 tweets sent with a positive connotation towards bitcoin, 30,947 with a neutral connotation, and 2,297 were negative.
What they said yesterday…
UK investment firm Ruffer Investment Company has just invested 2.5% of their holdings into Bitcoin, selling gold to get into BTC. Prepare for a wave of stories like this over the coming weeks. https://t.co/MvCZxENfUp
— Cointelegraph (@Cointelegraph) December 15, 2020
UPDATED:
Bitcoin market cap ($360 billion) as a percent of gold in circulation ($11.7 trillion) = 3% https://t.co/fXeSZH08ib— Barry Silbert (@BarrySilbert) December 15, 2020
In 2013 you could have spent 300 bitcoin on a Virgin Galactic ticket and you’d still be on the ground today.
Or you could have HODL’d and gone to the moon.
— Jameson Lopp (@lopp) December 16, 2020
Did you find this useful?