Discover
 Help Centre
 Status
 Company
 Careers
 Press
PressDaily market update: Bitcoin volumes keep pace – can the charge be sustained?

Bitcoin’s recovery after the September slump appears to be well on its way, with another bump yesterday. Volumes also now appear to be keeping pace. Twitter is, understandably, abuzz with talk of a new all-time high – but is such talk premature?
Here’s all the latest market movements. If you’re new to the world of crypto trading and want to know how to best use these indicators to trade, don’t forget to take a look through our beginner’s guide to crypto trading series, featuring in-depth explorations of common strategies, market analysis techniques, and more.
The content of this article is for information purposes only and is not investment advice or any form of recommendation or invitation. Luno always advises you to obtain your own independent financial advice before investing or trading in cryptocurrency.
All information is correct as of 08:30am BST.
Bitcoin price
We closed yesterday, 12 October, 2020, at a price of $11,555.36, with a daily high of $11,698.47 and a low of $11,240.69. That’s the highest daily closing price since 1 September.
On 12 October, 2019, the closing price was $8,336.56. On 12 October, 2018, it was $6,274.58 and the same date in 2017 was $5,446.91.
We’re 42.48% below bitcoin‘s all-time high of $20,089 (17 December 2017).
Bitcoin volume
The volume traded yesterday was $26,163,972,642 – up from $19,968,627,060 the day before. High volume indicates that a significant price movement has stronger support and is more likely to be sustained.
Market capitalisation
Bitcoin’s market capitalisation as of yesterday was $213,950,143,824, up from $210,766,812,992 the day before. To put that into context, Jeff Bezos is currently worth $175.3 billion. This means he can only afford to buy 81.93% of all bitcoin.
As of today, buying bitcoin has been profitable for…
95.8% of all days since 2013-04-28.
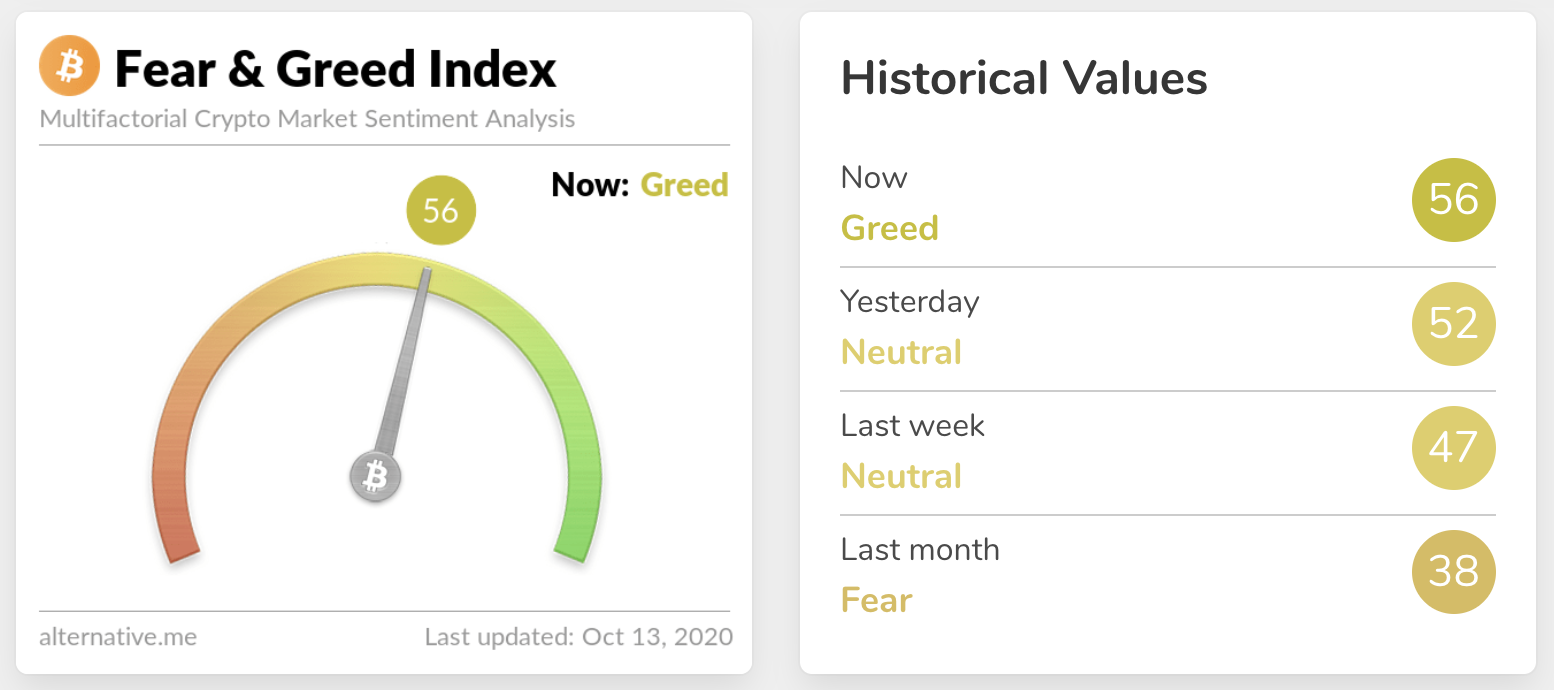
Fear and Greed Index
Sentiment is at 56 – up from 52 yesterday. Extreme fear can be a sign that investors are too worried, which could be a buying opportunity. When Investors are getting too greedy, that means the market may be due for a correction.
Twitter sentiment
Yesterday, there were 10,441 tweets sent with a positive connotation towards bitcoin, 23,664 with a neutral connotation, and 1,755 were negative.
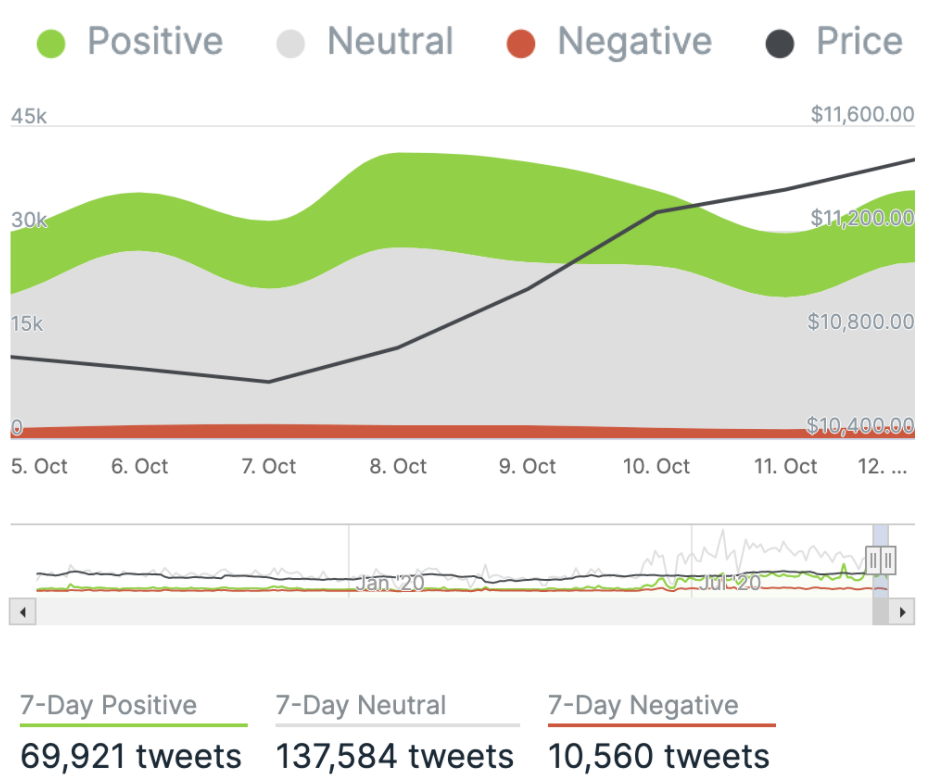
Chart provided by IntoTheBlock.com
Global In/Out of the money
For any address with a balance of tokens, ITB identifies the average price (cost) at which those tokens were purchased and compares it with the current price. If the current price is higher than average cost, address is ‘In the Money’. If the current price is lower than the average cost, the address is ‘Out of the Money’.
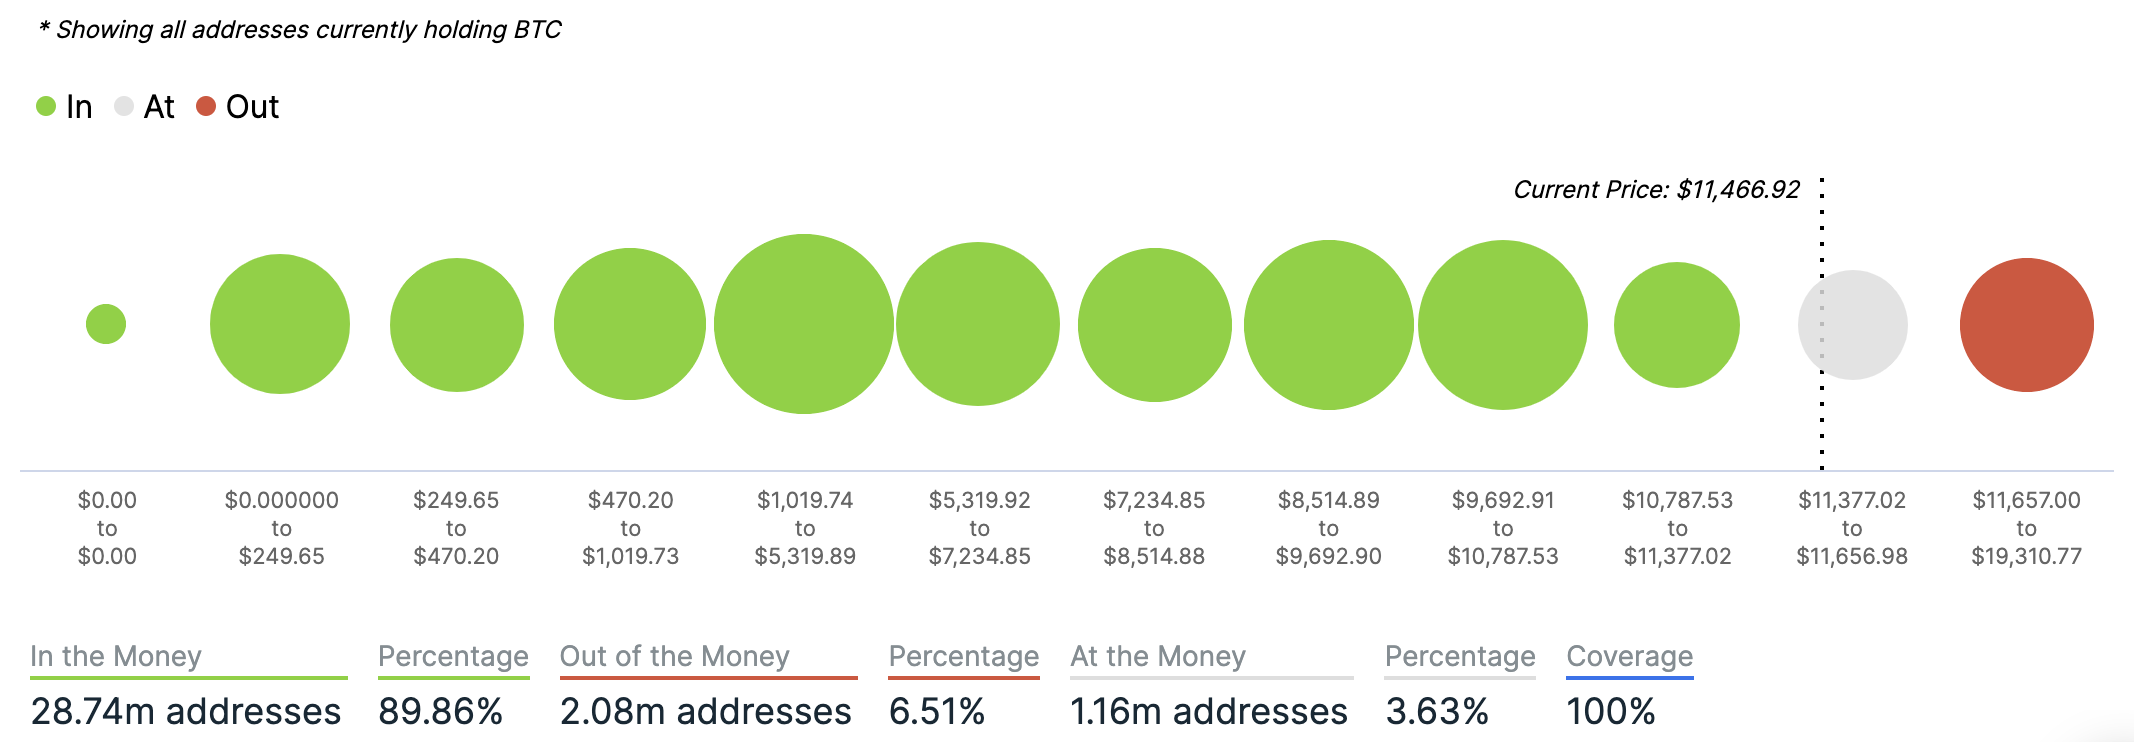
Chart provided by IntoTheBlock.com
Volatility
Annualised price volatility using 365 days.
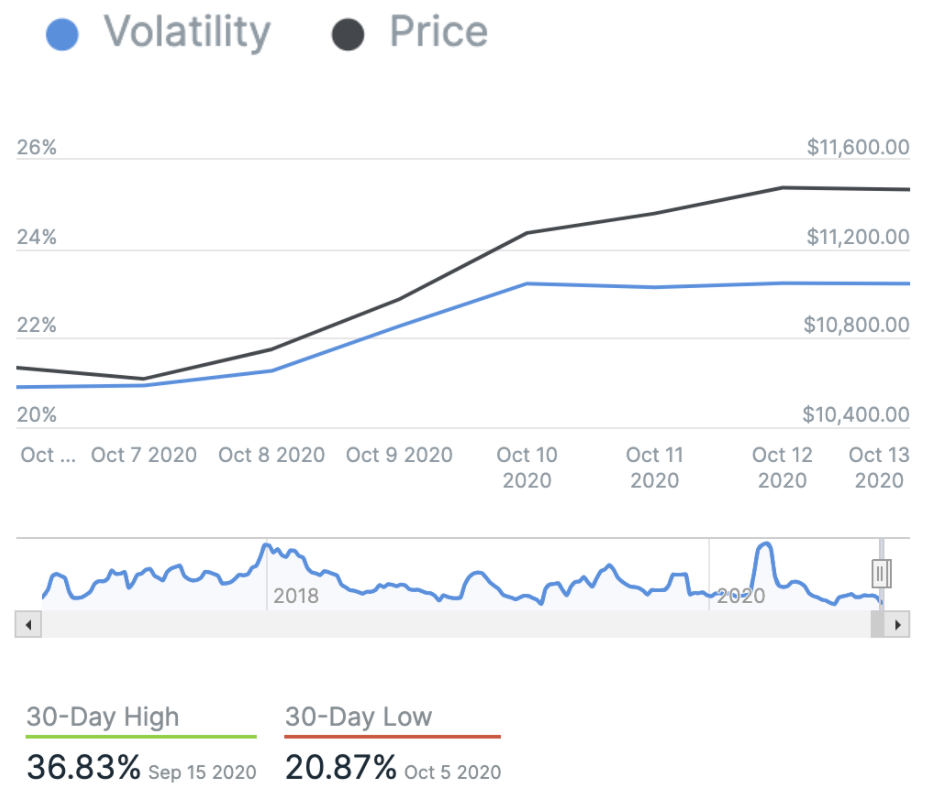
Chart provided by IntoTheBlock.com
Bitcoin’s market dominance
Bitcoin’s market dominance stands at 59.67. Its lowest recorded dominance was 37.09 on 8 January, 2018.
Relative Strength Index (RSI)
The daily RSI is currently 64.18. Values of 70 or above indicate that an asset is becoming overbought and may be primed for a trend reversal or experience correction in price – an RSI reading of 30 or below indicates an oversold or undervalued condition.
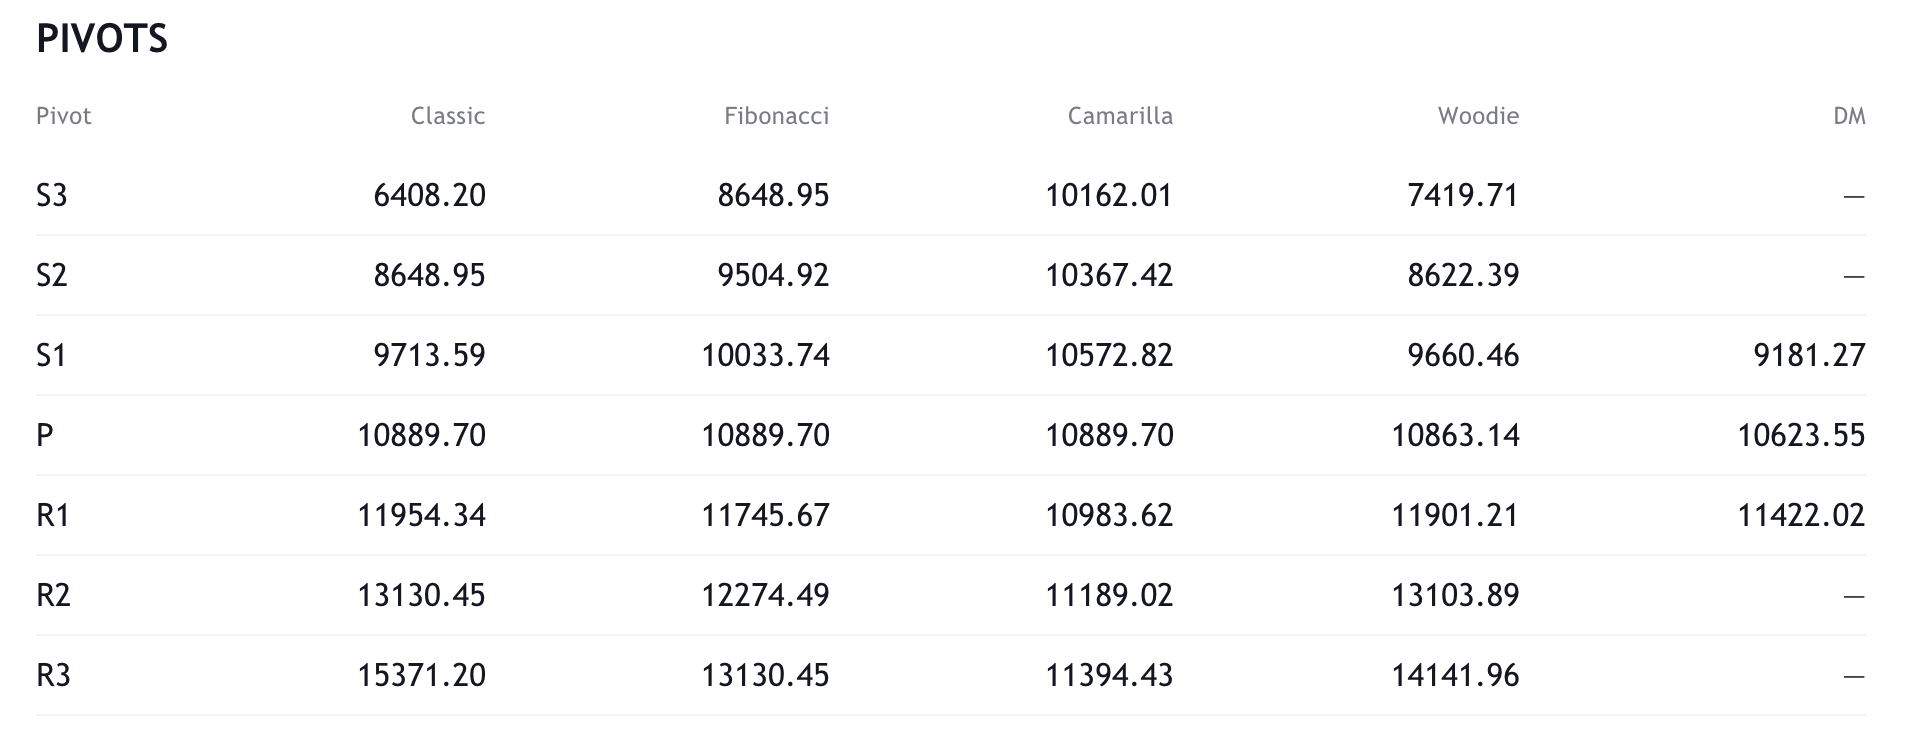
Resistance and support
What they said yesterday…
Bitcoin is BOOMING!
— Bill Pulte (@pulte) October 12, 2020
“I can’t afford to buy bitcoin.”
$1 currently buys 8,641 sats.— Jameson Lopp (@lopp) October 12, 2020
Silbert is a bitcoin bull bull bull
— Barry Silbert (@barrysilbert) October 12, 2020
What other data points would you like to see covered in our Daily Report? Let us know on Twitter.
Did you find this useful?