Discover
 Help Centre
 Status
 Company
 Careers
 Press
PressDaily market update: Bitcoin’s record breaking $10k+ winning streak continues

It’s Monday, but it’s not just any Monday. It’s a record breaking Monday! That’s the best kind! The bitcoin price has now exceeded $10,000 for more than 63 days. Bitcoin’s previous longest streak above $10,000 lasted 62 days from 1 Dec, 2017, through 31 Jan, 2018, when bitcoin reached its all-time high of just above $19,900. Bullish?
If you’re new to the world of crypto trading, don’t forget to take a look through our beginner’s guide to crypto trading series, starring in-depth explorations of common strategies, market analysis techniques, and more.
The content of this article is for information purposes only and is not investment advice or any form of recommendation or invitation. Luno always advises you to obtain your own independent financial advice before investing or trading in cryptocurrency.
All information is correct as of 10:00am BST.
Bitcoin price
We closed yesterday, 27 September, 2020, at a price of $10,774.43 – with a daily high of $10,804.73 and a low of $10,643.46.
That’s the highest closing price since 20 September, when it was 10,938.27. On the 27 September, 2019, one bitcoin would have cost you $8,251.85.
We’re 46.47% below bitcoin‘s all-time high of $20,089 (17 December 2017).
Bitcoin volume
The volume traded yesterday was $18,016,880,214 – down from $18,105,012,128 the day before. That’s the lowest daily volume since 29 August.
Market capitalisation
Bitcoin’s market capitalisation as of yesterday was $199,347,495,686, up from $198,967,310,682 the day before. To put that into context, Jeff Bezos is now worth $175 billion. This means he can only afford to buy 87.79% of all bitcoin. Not today, Jeff. Better sell a few more books, mate.
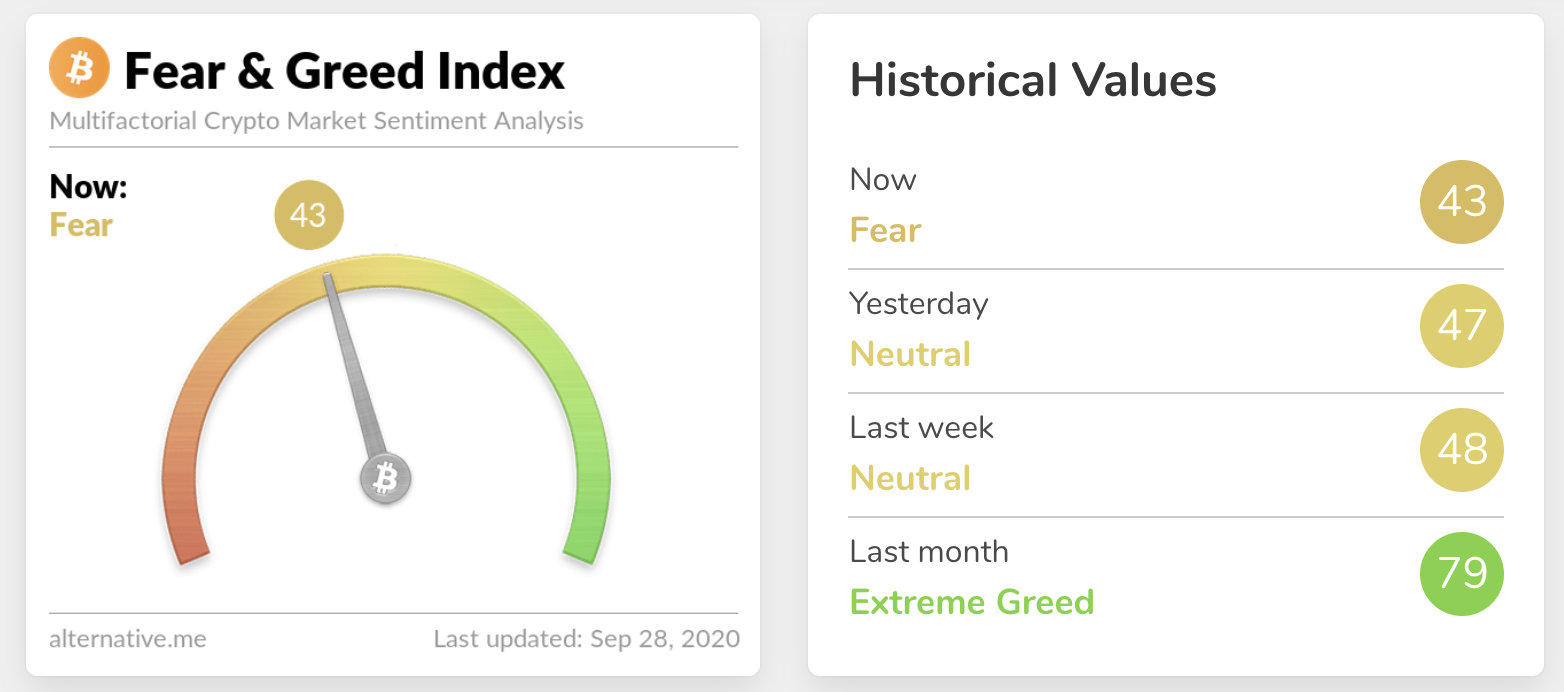
Fear and Greed Index
Sentiment is back down at 43, down from 47 yesterday. We’ve now spent just 1 day outside the Fear zone since the massive drop out of Extreme Greed on 4 September.
Extreme fear can be a sign that investors are too worried, which could be a buying opportunity. When Investors are getting too greedy, that means the market may be due for a correction.
Global In/Out of the money
For any address with a balance of tokens, ITB identifies the average price (cost) at which those tokens were purchased and compares it with the current price. If the current price is higher than average cost, address is ‘In the Money’. If the current price is lower than the average cost, the address is ‘Out of the Money’.
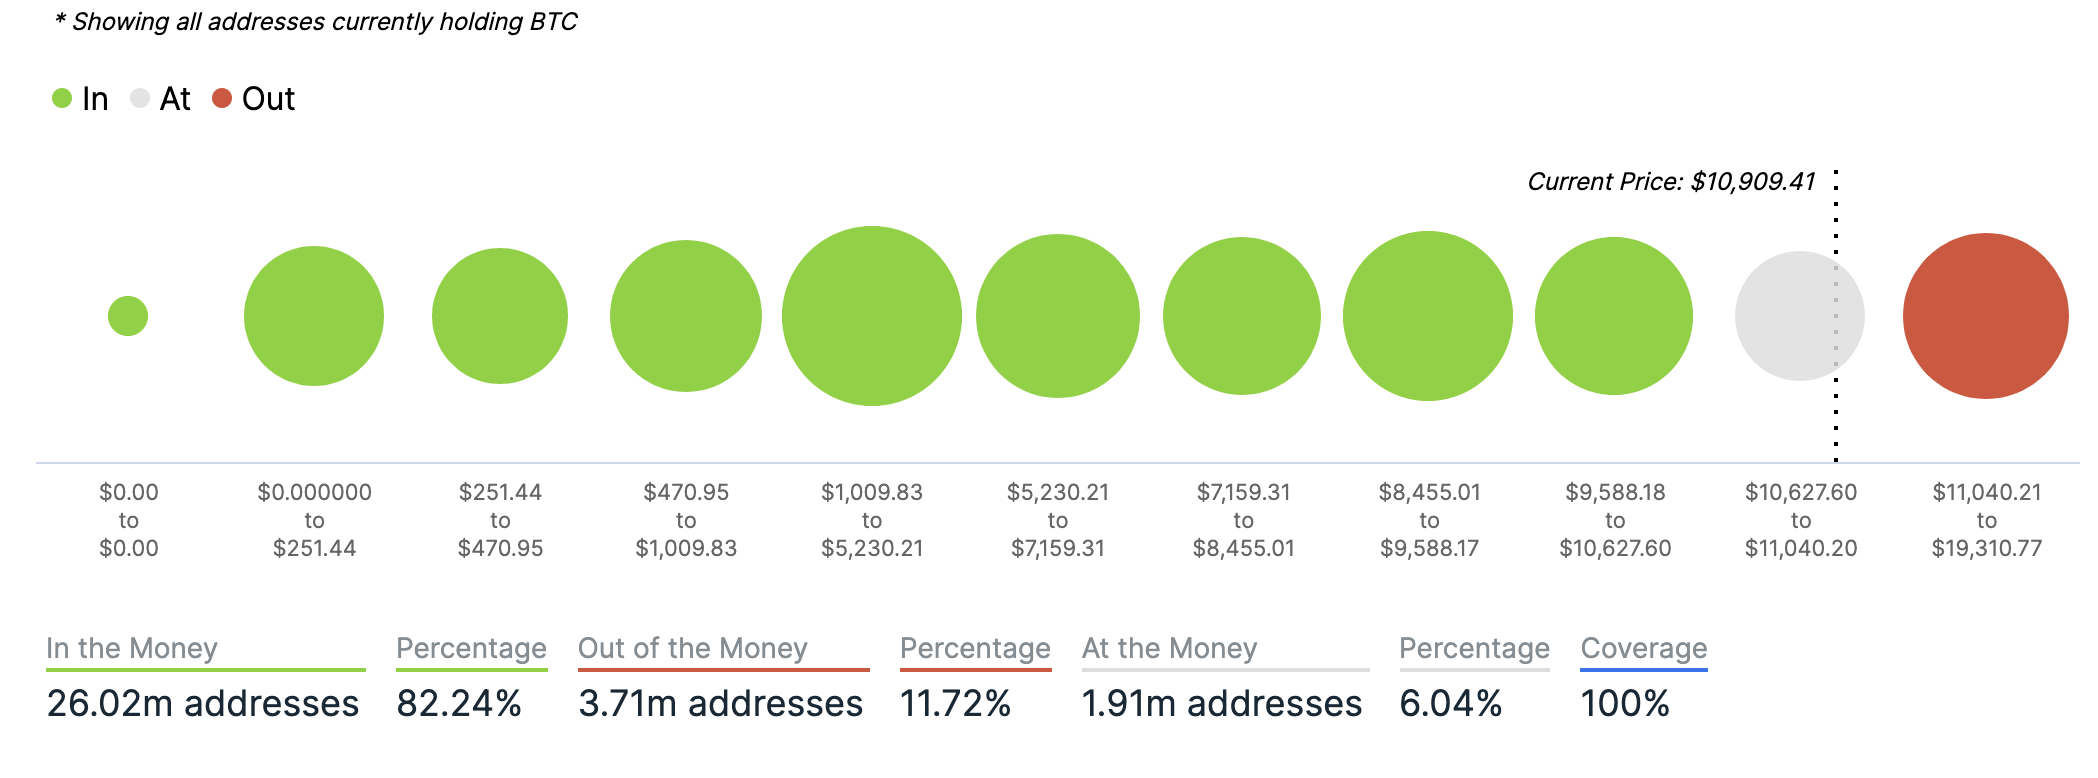
Chart courtesy of IntotheBlock.com
Volatility
Annualised price volatility using 365 days.
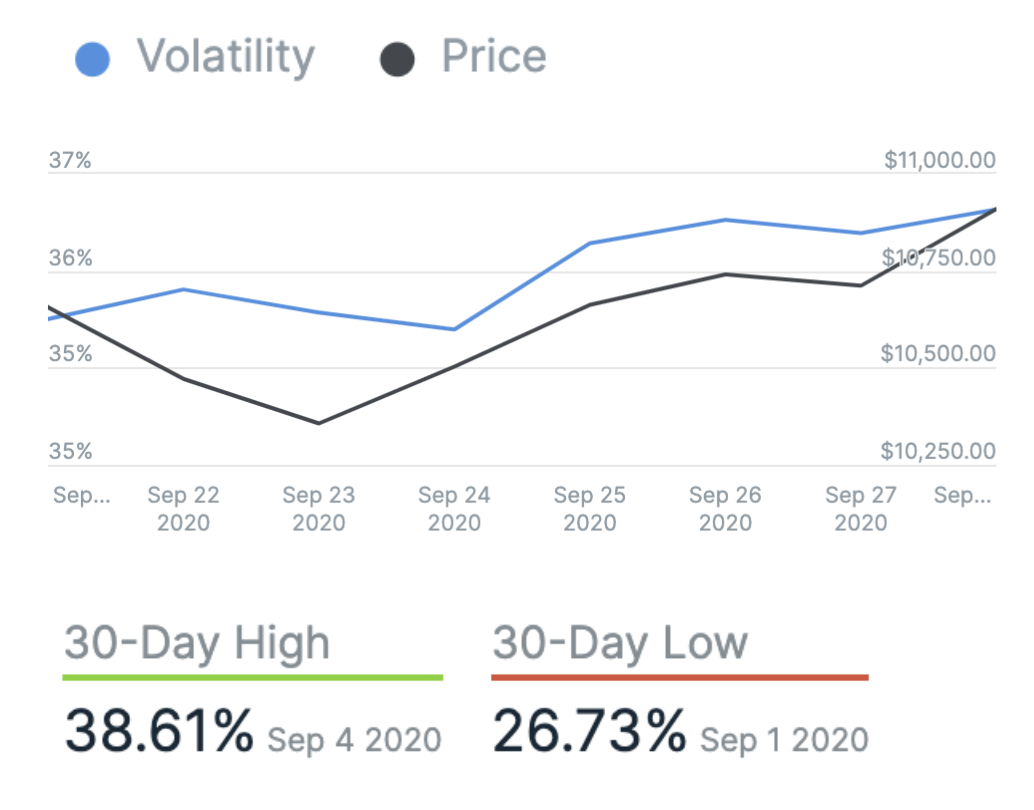
Chart courtesy of IntotheBlock.com
Bitcoin’s market dominance
Bitcoin’s market dominance stands at 61.08. Its lowest recorded dominance was 37.09 on 8 January, 2018.
Relative Strength Index (RSI)
The daily RSI is currently 51.98. Values of 70 or above indicate that an asset is becoming overbought and may be primed for a trend reversal or experience correction in price – an RSI reading of 30 or below indicates an oversold or undervalued condition.
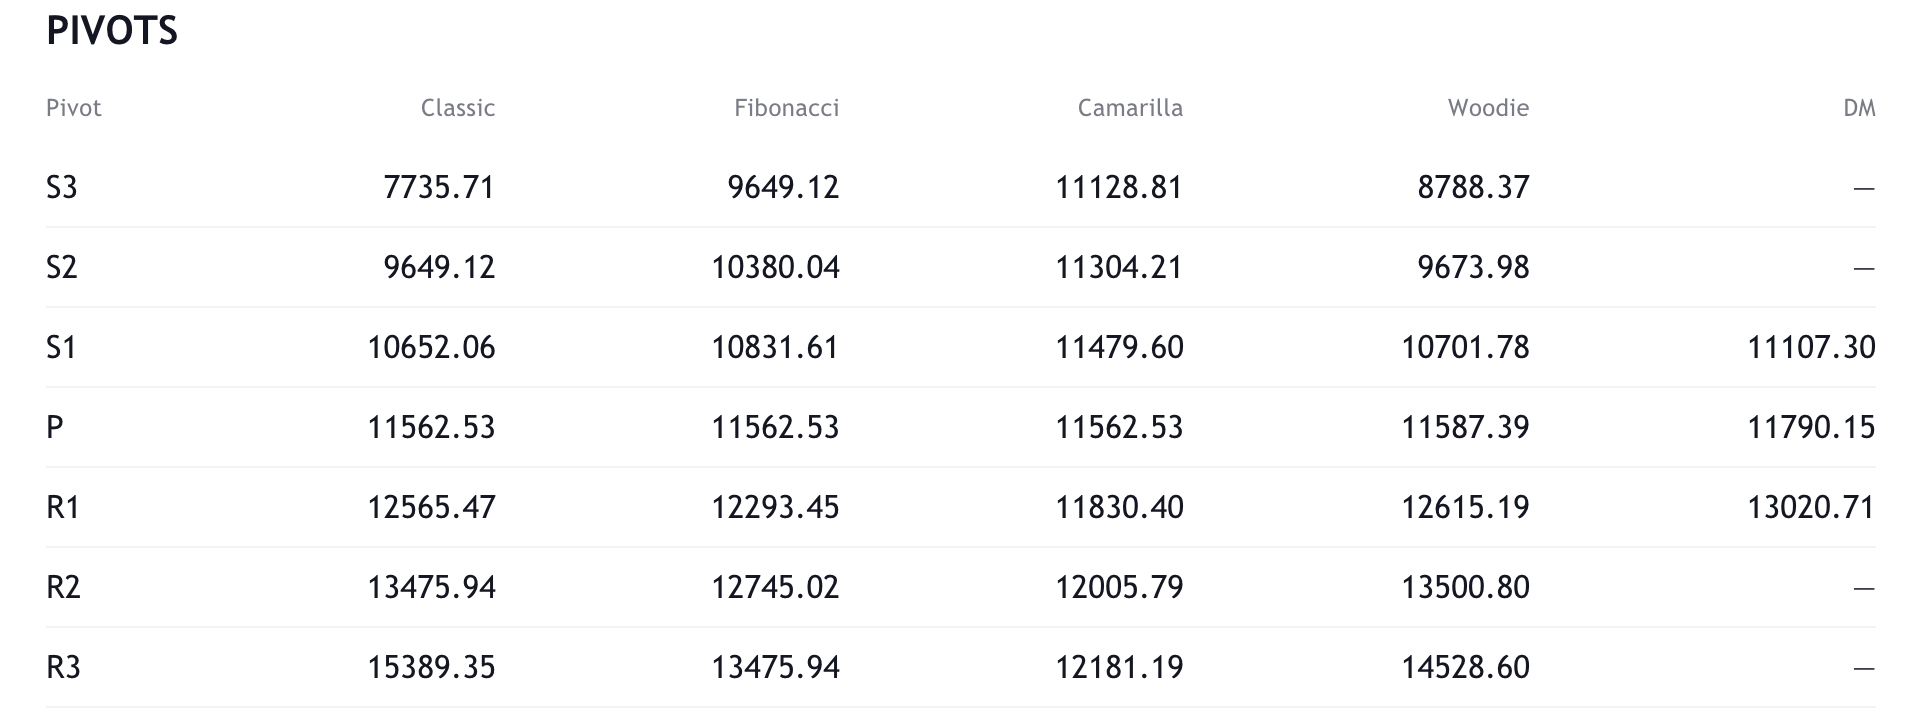
Resistance and support
What they said yesterday…
Dear Bitcoin haters,
Bitcoin has spent a record 63 straight days above $10,000 and is only showing signs of going higher.
The market is proving your bearishness wrong. There is always time to capitulate & join the party 🙂
Love,
Pomp— Pomp ? (@APompliano) September 28, 2020
The success of #Bitcoin will be a function of Adoption (as Hodlers invest their assets in BTC as a SoV), Utility (as technology makes it harder, smarter, faster, & stronger money), Productivity (as Hodlers invest their free cash flows), & Inflation (of competing assets for SoV).
— Michael Saylor (@michael_saylor) September 27, 2020
Demand for Bitcoin is rising, but there is less than 2.5 million BTC left to mine https://t.co/HSb3EEqD7J
— Cointelegraph (@Cointelegraph) September 27, 2020
#Bitcoin will do to banks what email did to the postal industry.
It’s called a #takeover
— The Moon ? (@TheMoonCarl) September 27, 2020
What other data points would you like to see covered in our Daily Report? Let us know on Twitter.
Did you find this useful?