Discover
 Help Centre
 Status
 Company
 Careers
 Press
PressDaily market update: BTC spends another weekend in “Greed” zone

We’re back with the latest metrics you need to inform your crypto trading. If you’re new to the world of crypto trading, take a look through our beginner’s guide to crypto trading series, starring in-depth explorations of common strategies, market analysis techniques, and more.
The content of this article is for information purposes only and is not investment advice or any form of recommendation or invitation. Luno always advises you to obtain your own independent financial advice before investing or trading in cryptocurrency.
All information is correct as of 10:00 SAST
Bitcoin price
We closed yesterday, 30 August 2020, at a price of $11,701.00 – with a daily high of $11,714.93 and a low of $11,557.60
On the same date last year, the closing price was $9,598.17
We’re 41.75% below bitcoin‘s all-time high of $20,089 (17 December 2017).
As of today, buying bitcoin has been profitable for…
95.7% of all days since 2013-04-28.
Bitcoin volume
The volume traded yesterday was $18,415,439,614 – down from $19,271,253,871 the day before.
Market capitalisation
Bitcoin’s market capitalisation as of yesterday was $212,114,842,612, down from $212,799,723,685 the day before. To put that into context, Jeff Bezos’s net worth is $196,000,000,000, which means he could only buy 92.40% of all Bitcoin. You can’t have everything, Jeff!
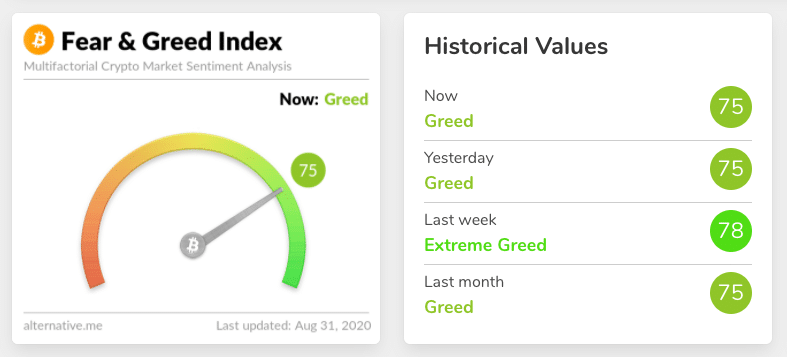
Fear and Greed Index
We’re down 3 points from 78 to 75, moving down from Extreme Greed to the general Greed zone. Extreme fear can be a sign that investors are too worried, which could be a buying opportunity. When Investors are getting too greedy, that means the market may be due for a correction.
Bitcoin’s market dominance
Bitcoin’s market dominance stands at 60.73. Its lowest recorded dominance was 37.09 on 8 January, 2018.
Relative Strength Index (RSI)
The daily RSI is currently 52.62. Values of 70 or above indicate that an asset is becoming overbought and may be primed for a trend reversal or experience correction in price – an RSI reading of 30 or below indicates an oversold or undervalued condition.
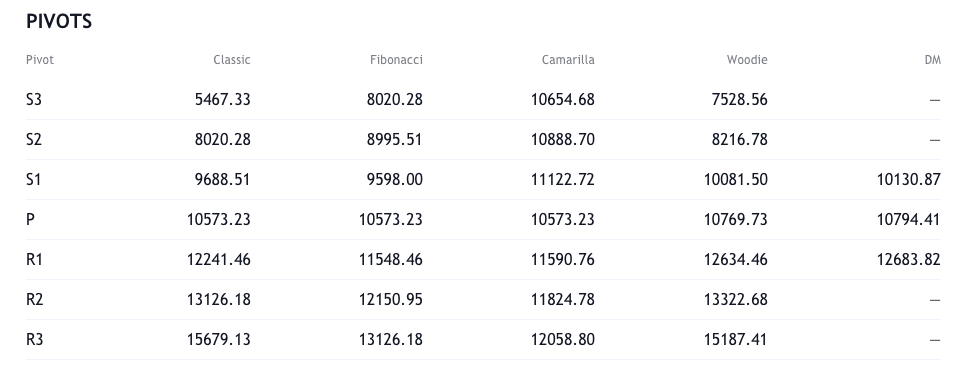
Resistance and support
What they said yesterday…
The Federal Reserve is officially the world’s biggest investor.
Think about that for a second. https://t.co/DbpZWqso8U
— Pomp ? (@APompliano) August 30, 2020
Ethereum Classic Suffers 51% Attack Again: Delisting Risk Amplified https://t.co/rLwsuMeapj pic.twitter.com/mxqvpfwAx8
— Bitcoin News (@BTCTN) August 30, 2020
Every time Bitcoin “dies” pic.twitter.com/4eSqCplOH3
— Jameson Lopp (@lopp) August 31, 2020
What other data points would you like to see covered in our Daily Report? Let us know on Twitter.
Did you find this useful?