Discover
 Help Centre
 Status
 Company
 Careers
 Press
PressDaily market update: Cryptocurrency hits Fear & Greed Index yearly high

Welcome to your daily update of all Bitcoin’s price movements yesterday, including price, volume, the fear and greed index, and more.
If you’re new to the world of crypto trading, check out our beginner’s guide to trading series, featuring in-depth looks at common strategies, market analysis techniques, and more.
The content of this article is for information purposes only and is not investment advice or any form of recommendation or invitation. Luno always advises you to obtain your own independent financial advice before investing or trading in cryptocurrency.
Bitcoin price
We closed yesterday, 10 August 2020, at a price of $11,878.11 – with a high of $12,045.14 and a low of $11,662.26.
It was the highest closing price since 9 August 2020 – almost a year ago exactly.
We’re still 40% below Bitcoin‘s all-time high of $20,089 (17 December 2017).
Bitcoin Volume
The volume traded yesterday was $26,114,112,569. That is the highest it’s been since 2 August 2020.
To put that into context, the highest ever 24-hour volume is $53,060,690,000, last year’s high was $29,060,690,000, and last year’s average was $15,060,690,000.
Bitcoin transactions
In total, 308,230 transactions were carried out yesterday – 3% below last year’s average and 31 percent below last year’s high.
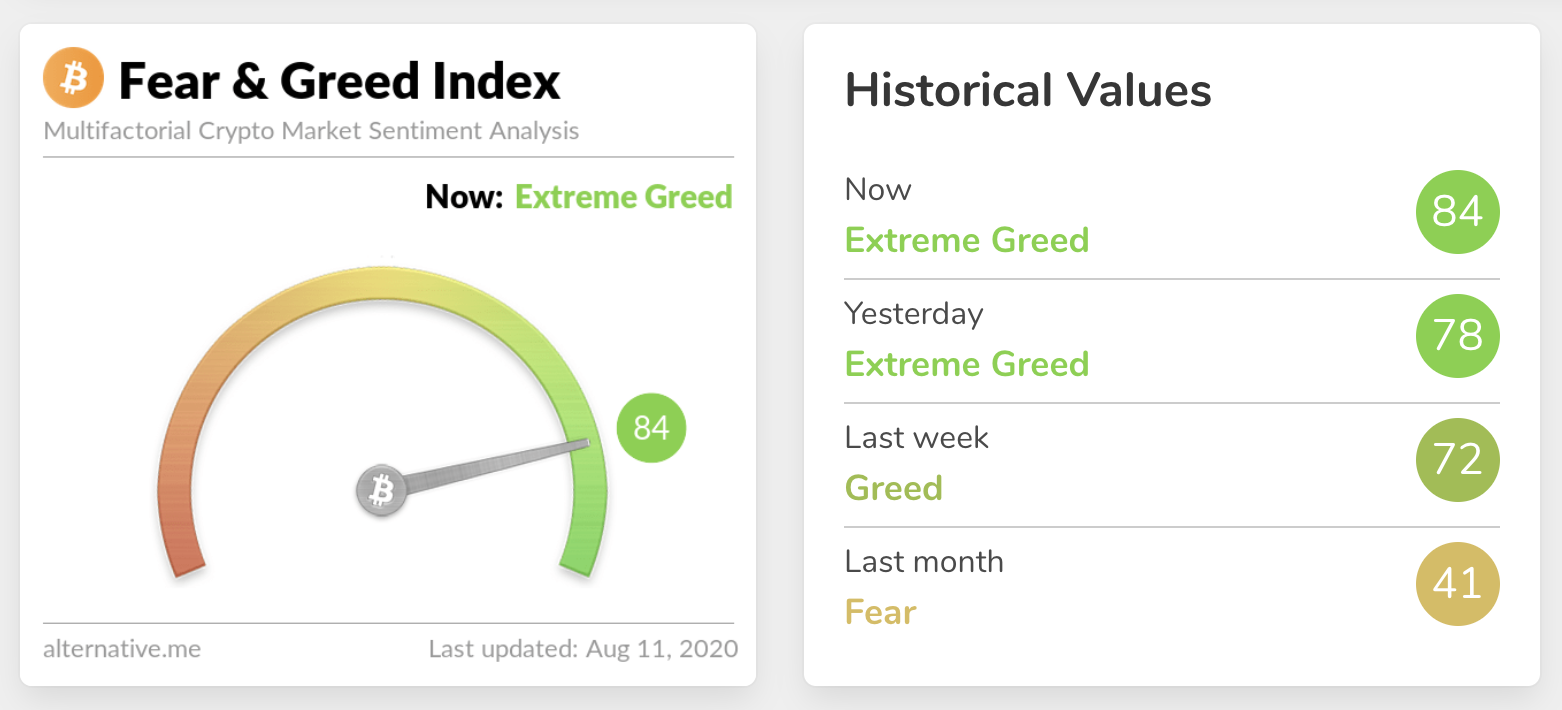
The Fear & Greed Index
The Fear & Greed Index measures emotions and sentiment in the cryptocurrency market. Yesterday closed in the Extreme Greed zone, rising to 84 yesterday – the highest it’s been since 9 July 2019. Extreme fear could be a sign that investors are too worried, which could be a buying opportunity. When Investors are getting too greedy, that means the market may be due for a correction.
Relative Strength Index (RSI)
The RSI currently stands at 66.91 over the last 24 hours (correct as of 9.00am BST). Values of 70 or above indicate that an asset is becoming overbought and may be primed for a trend reversal or experience correction in price. – an RSI reading of 30 or below indicates an oversold or undervalued condition.
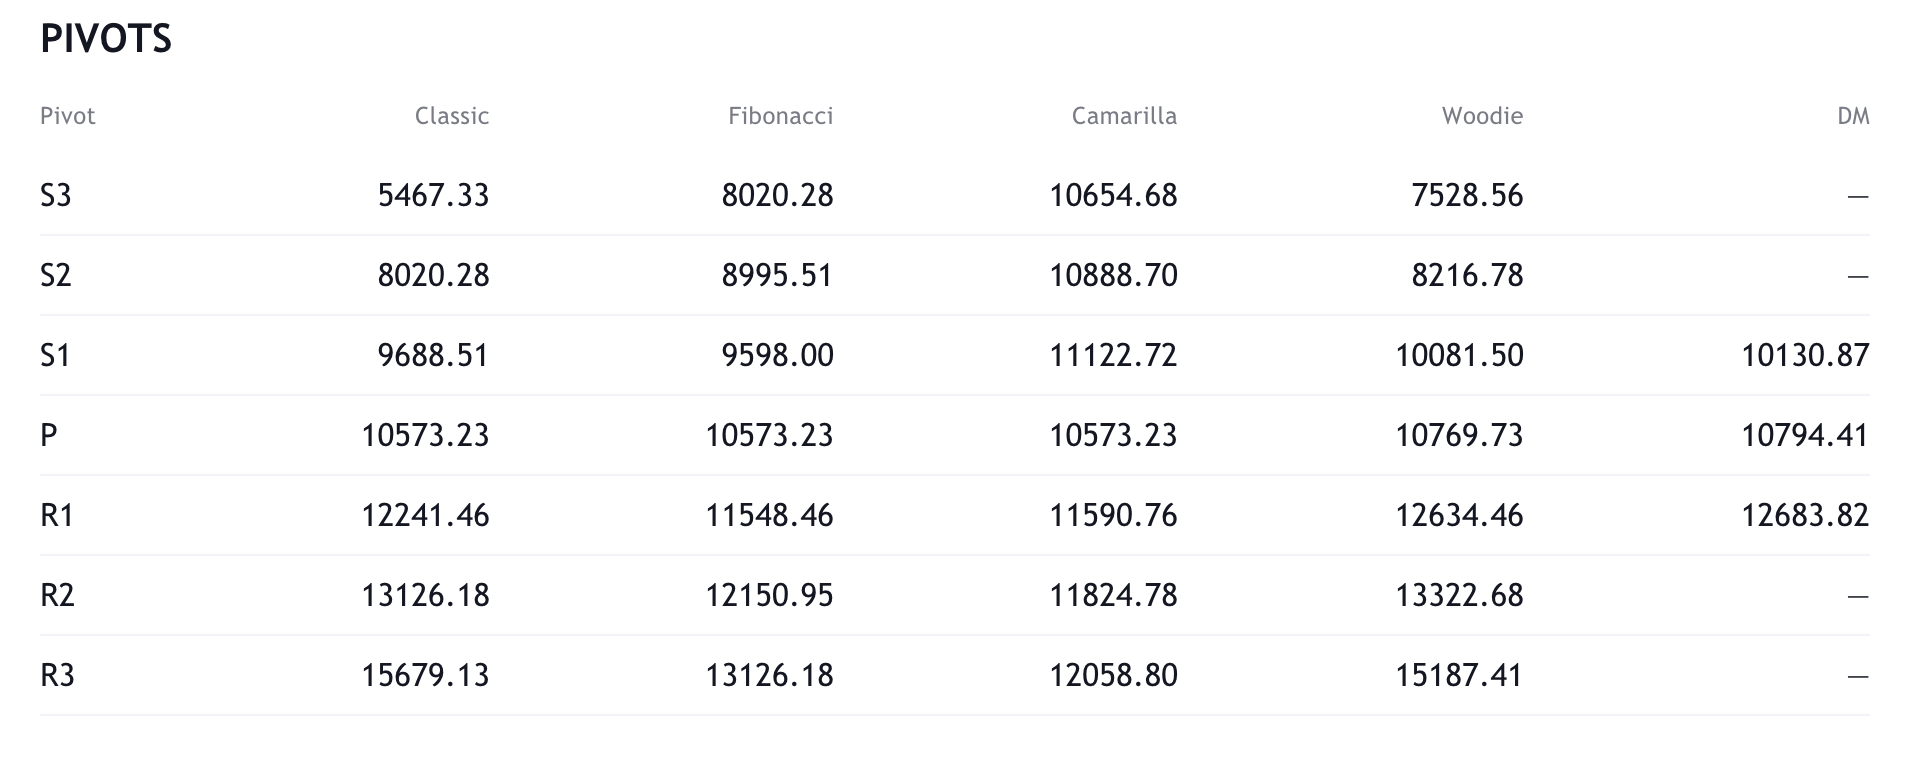
Resistance and support levels
What they said yesterday…
Bitcoin mining is once again profitable. pic.twitter.com/FTAinTKzcP
— Charles Edwards (@caprioleio) August 10, 2020
#Bitcoin is the greatest social network of all time.
— Tyler Winklevoss (@tylerwinklevoss) August 10, 2020
“Behind the #Bitcoin, the technology itself, really very powerful.” @JackMa pic.twitter.com/U2onDo5bis
— Bitcoin (@Bitcoin) August 10, 2020
What other data points would you like to see covered in our Daily Report? Let us know on Twitter.
Did you find this useful?