Discover
 Help Centre
 Status
 Company
 Careers
 Press
PressDaily market update: Ether on the rise and bitcoin holds above $11k

Here’s all the latest market movements. Today, we’ve got a special treat, looking at some on-chain indicators for Ether, which has gone up more than 9% over the past week. If you’re new to the world of crypto trading and want to know how to best use these metrics to trade, don’t forget to take a look through our beginner’s guide to crypto trading series, featuring in-depth explorations of common strategies, market analysis techniques, and more.
The content of this article is for information purposes only and is not investment advice or any form of recommendation or invitation. Luno always advises you to obtain your own independent financial advice before investing or trading in cryptocurrency.
All information is correct as of 09:00am BST.
Bitcoin price
We closed yesterday, 13 October, 2020, at a price of $11,425.90, with a daily high of $11,548.98 and a low of $11,321.22. That’s the highest low since 1 September.
On 13 October, 2019, the closing price was $8,321.01. On 13 October, 2018, it was $6,285.99 and the same date in 2017 was $5,647.21.
We’re 43.12% below bitcoin‘s all-time high of $20,089 (17 December 2017).
Bitcoin volume
The volume traded yesterday was $24,241,420,251 – down from $26,163,972,642 the day before. High volume indicates that a significant price movement has stronger support and is more likely to be sustained.
Market capitalisation
Bitcoin’s market capitalisation as of yesterday was $211,565,586,739, down from $213,950,143,824 the day before. To put that into context, Jeff Bezos is currently worth $175.3 billion. This means he can only afford to buy 82.86% of all bitcoin. DENIED!
As of today, buying bitcoin has been profitable for…
95.5% of all days since 2013-04-28.
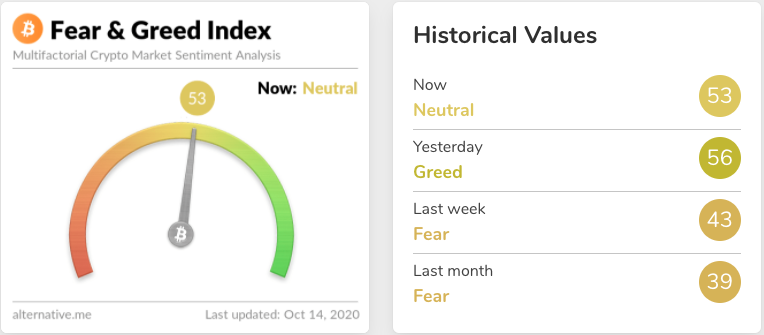
Fear and Greed Index
Sentiment is back at a neutral 53 – down from 56 yesterday. Extreme fear can be a sign that investors are too worried, which could be a buying opportunity. When Investors are getting too greedy, that means the market may be due for a correction. Are we set for a big move?
Twitter sentiment
Yesterday, there were 10,435 tweets sent with a positive connotation towards bitcoin, 23,116 with a neutral connotation, and 1,798 were negative.
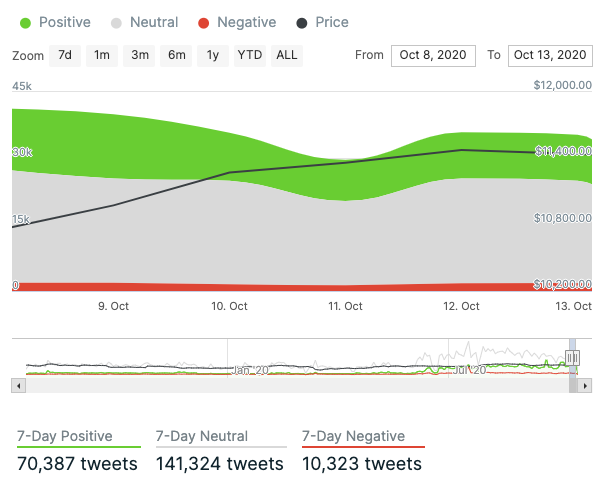
Chart provided by IntoTheBlock.com
Global In/Out of the money
For any address with a balance of tokens, ITB identifies the average price (cost) at which those tokens were purchased and compares it with the current price. If the current price is higher than average cost, address is ‘In the Money’. If the current price is lower than the average cost, the address is ‘Out of the Money’.
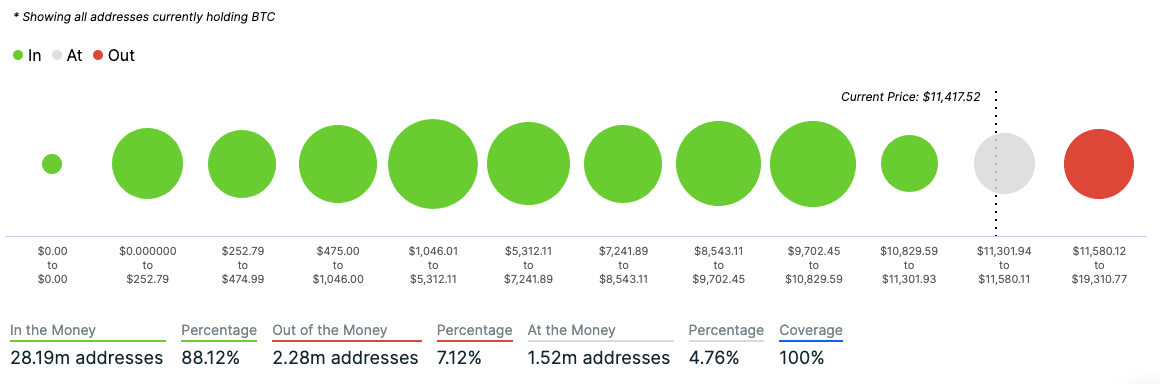
Chart provided by IntoTheBlock.com
Volatility
Annualised price volatility using 365 days.
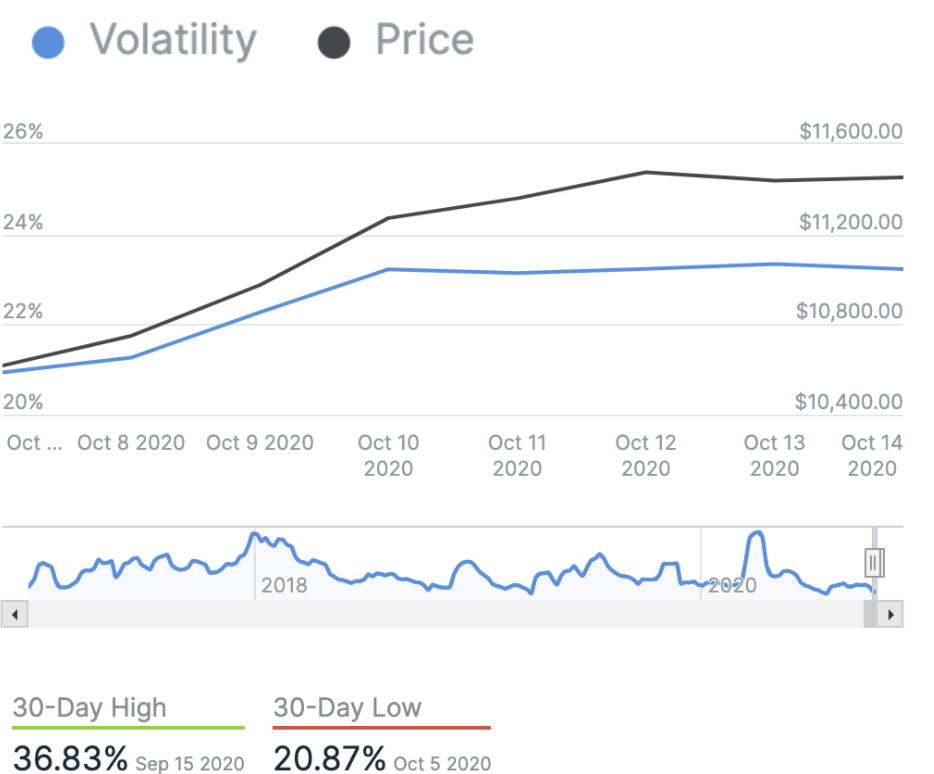
Chart provided by IntoTheBlock.com
Bitcoin’s market dominance
Bitcoin’s market dominance stands at 59.71. Its lowest recorded dominance was 37.09 on 8 January, 2018.
Relative Strength Index (RSI)
The daily RSI is currently 62.58. Values of 70 or above indicate that an asset is becoming overbought and may be primed for a trend reversal or experience correction in price – an RSI reading of 30 or below indicates an oversold or undervalued condition.
Resistance and support
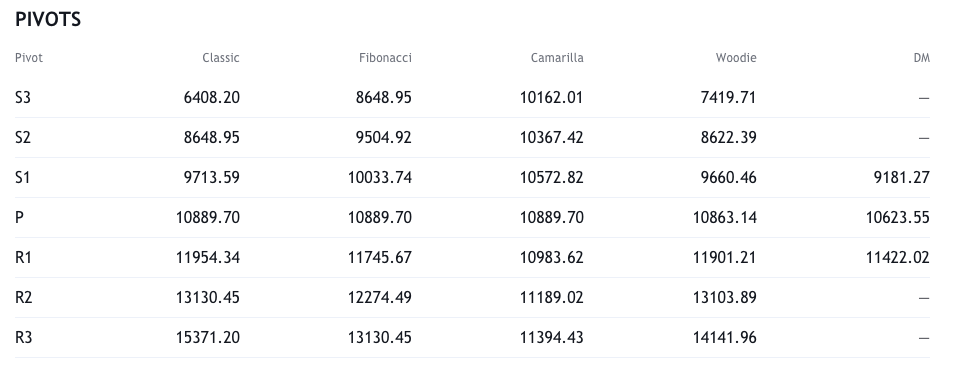
Derivatives indicators confirm the bullish momentum for ether
Following the recent price action, our derivatives market indicators are showing some classic textbook bullish signals.
As can be seen in the graph below, open interest in Ethereum’s perpetual swaps is rising in line with the rising prices. This can be interpreted as a bullish signal as new money is coming into the market (reflecting new positions). A simultaneous rise in the volume of perpetual swaps alongside increasing open interest shows strong market momentum, as ETH is gaining more interest among investors.
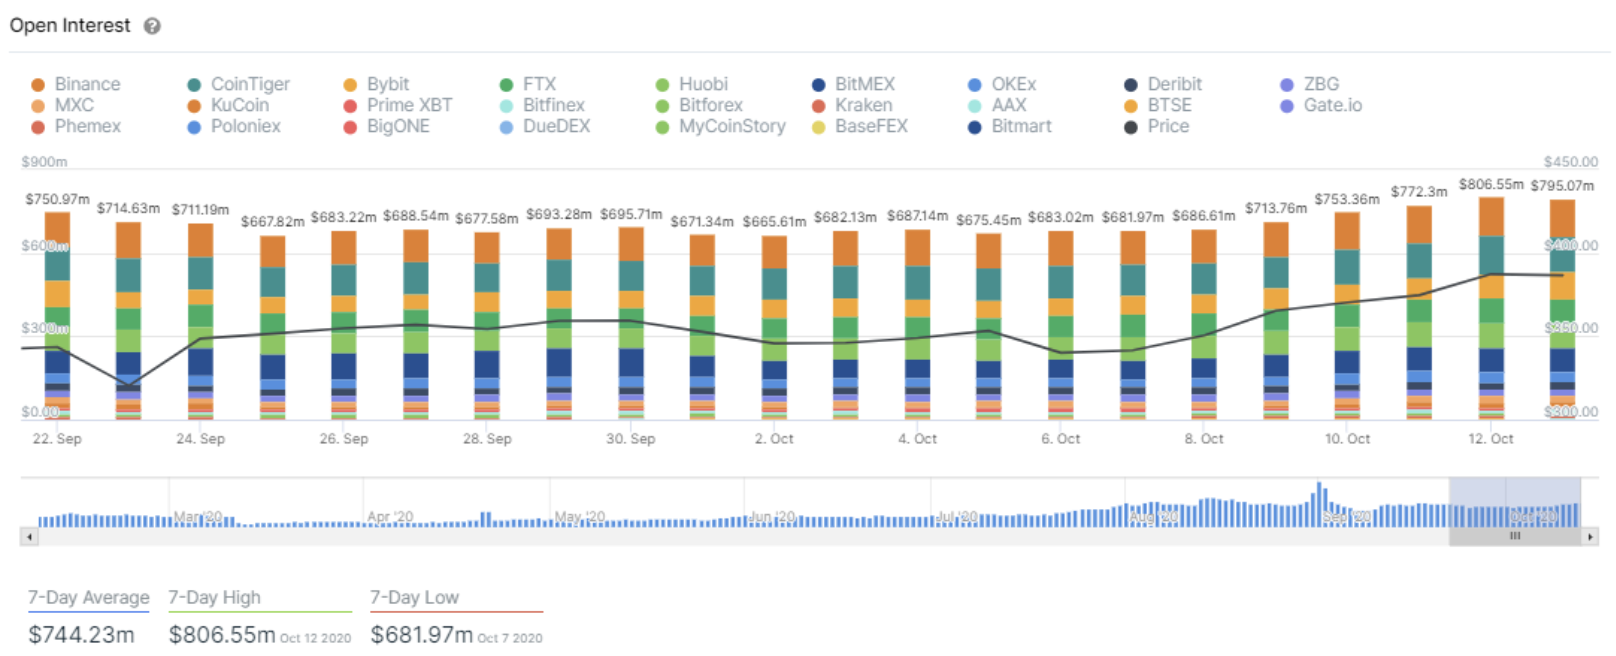
See the Ethereum Perpetual Swaps indicators
By analysing on-chain positions, Ethereum is facing low resistance to reach $400 again
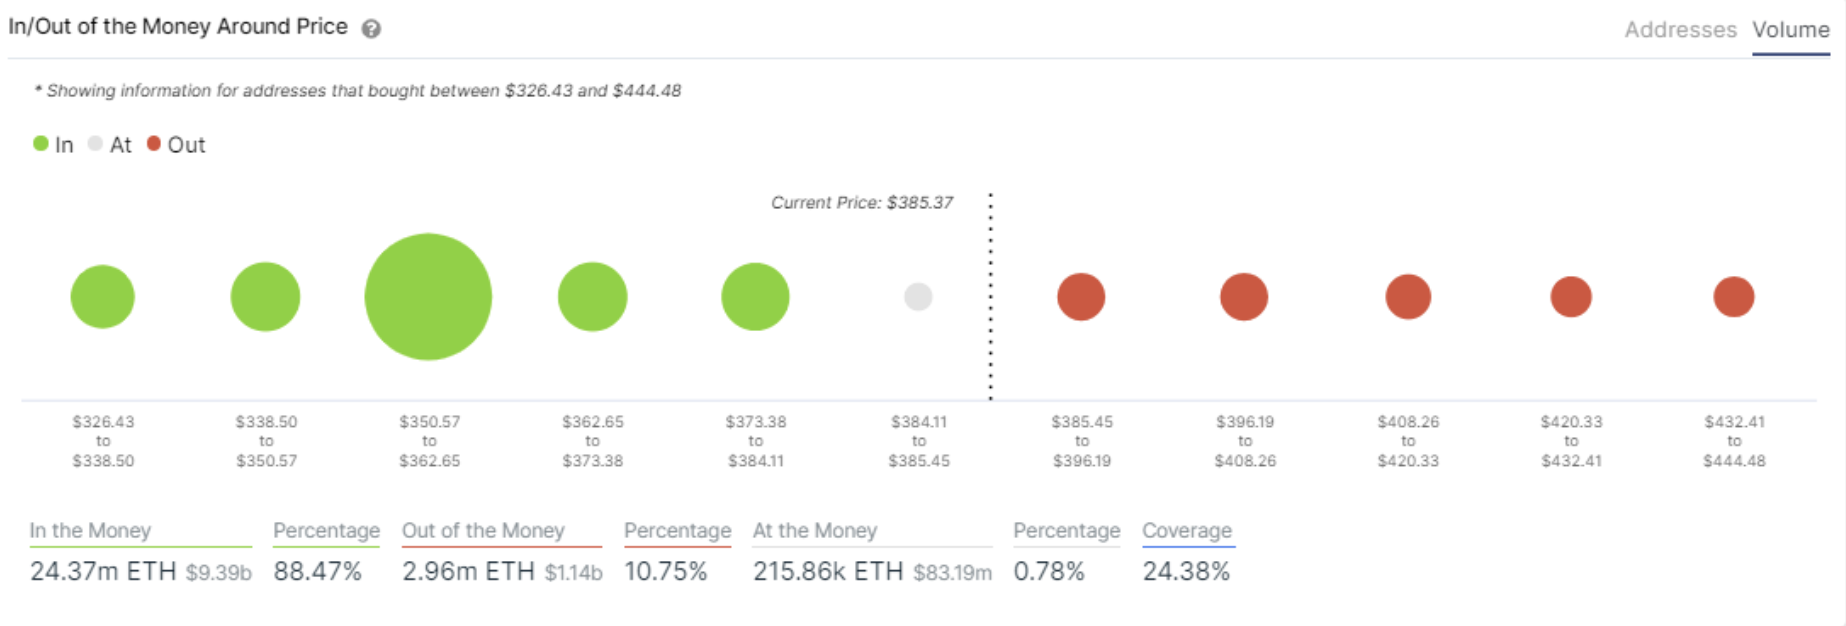
See the Ethereum In/Out of the Money Stats
Intotheblock’s In-Out Money Around the Current Price(IOMAP) uses machine learning to identify the ten most relevant clusters of investor positions at a range of plus-minus 15 percent of the current price. The IOMAP indicator reveals that there aren’t significant supply barriers ahead of Ethereum that would obstruct the rise to $400.
The next level of resistance is located between $385 and $396, where 914 thousand addresses previously purchased 756.49 ETH.
Looking at the levels of support, over 1.01 million addresses had previously purchased a total of 14.74 million ETH between $350 and $362. This is expected to act as support as holders in this range will attempt to remain profitable on their positions and push prices above this level.
There are more addresses making money in Ethereum than the total number of addresses holding Bitcoin
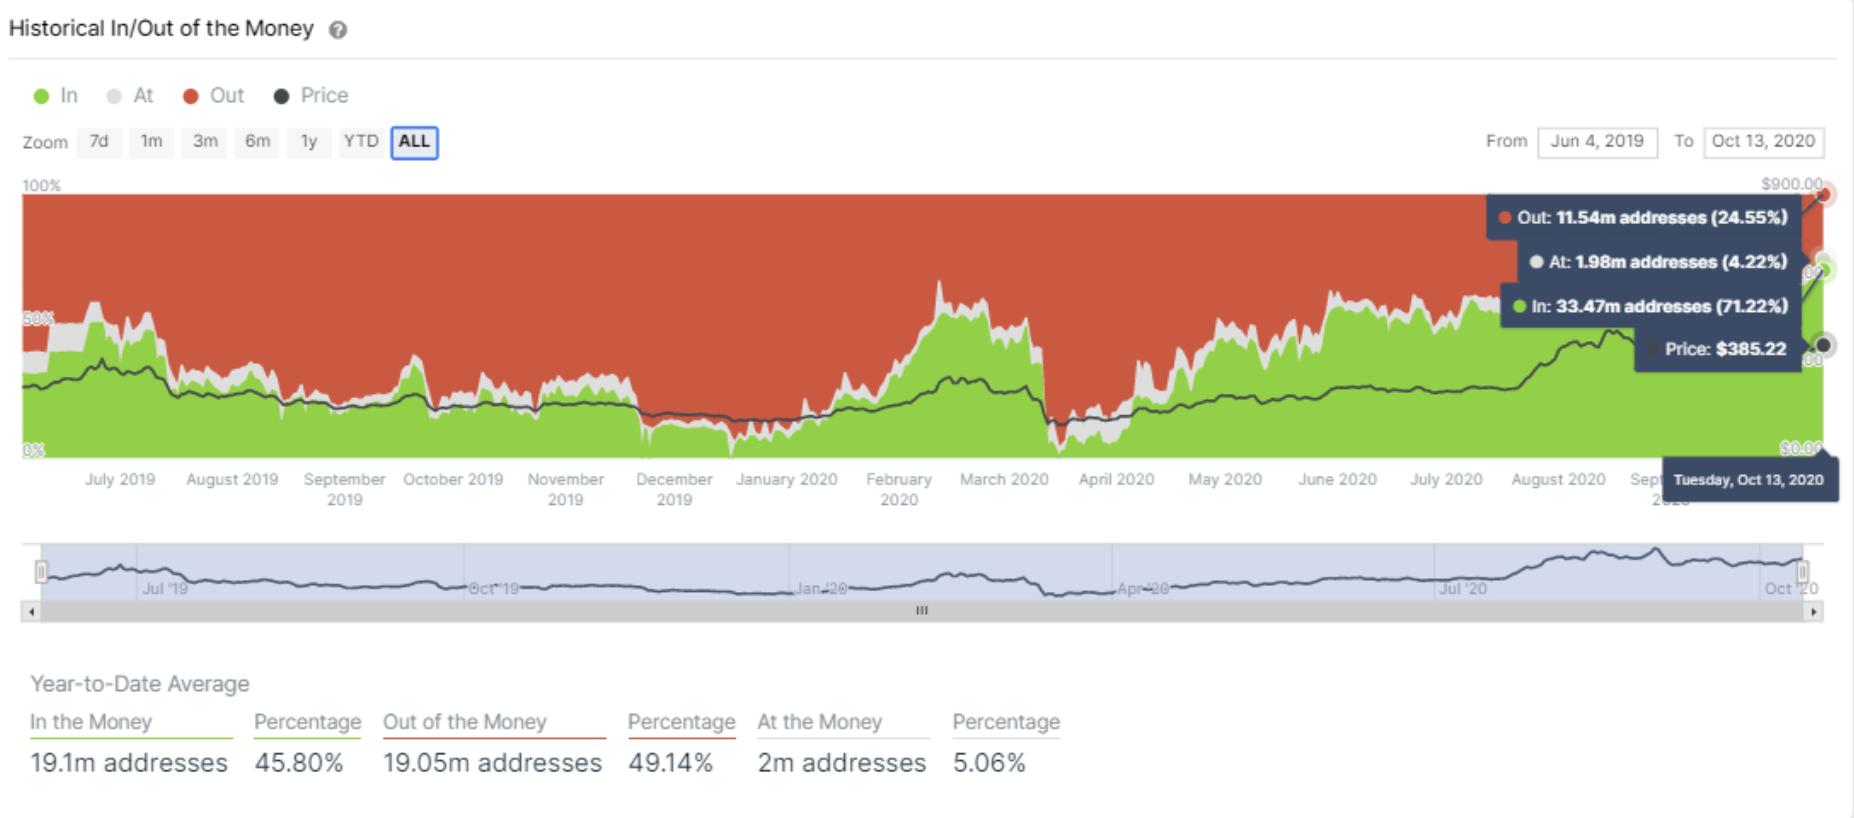
See the Ethereum In/Out of the Money Stats
IntoTheBlock’s Historical In/Out of the Money (HIOM) indicator analyses investors’ on-chain positions based on addresses’ average cost for a given token, in this case YFI. Based on this, the HIOM calculates the percentage and total number of addresses that are “in the money”, or profiting on their paper positions (unrealised profits). By comparing variations in the HIOM over time, we can determine buying/selling activity based on the number of addresses profiting at a specific price level.
At the time of writing, 71.22% Ether addresses are making money in their position (on paper at least) at a price of $385.22. This means that the number of Ether addresses profiting (32.88 million) has now surpassed the total number of Bitcoin addresses with a balance (31.02 million).
What they said yesterday…
#Bitcoin is the first digital monetary system capable of storing all the money in the world for every individual, corporation, and government in a fair & equitable manner, without losing any of it. If that’s not intrinsically valuable, what is? https://t.co/LWwmnNC0v0
— Michael Saylor (@michael_saylor) October 13, 2020
#Bitcoin looking strong. Poised for a breakout bull run into the New Year.
— Tyler Winklevoss (@tylerwinklevoss) October 13, 2020
Fidelity just recommended that investors allocate 5% to Bitcoin.
Fidelity has $3.3 trillion AUM.
Investing 5% into Bitcoin would be an additional $165 billion of capital flooding into Bitcoin.
You have to be crazy to not own Bitcoin at this point.
— Yano (@JasonYanowitz) October 14, 2020
What other data points would you like to see covered in our Daily Report? Let us know on Twitter.
Did you find this useful?