Discover
 Help Centre
 Status
 Company
 Careers
 Press
PressDaily market update: Top banks caught out in FinCEN files make a bullish case for bitcoin?

Over the weekend, leaked documents involving around $2 trillion of transactions revealed how some of the world’s biggest banks have enabled criminals to move dirty money across the globe. Could this mean a bullish week ahead for bitcoin?
In other news, we’re back with all the latest metrics you need to inform your crypto trading. If you’re new to the world of crypto trading, take a look through our beginner’s guide to crypto trading series, starring in-depth explorations of common strategies, market analysis techniques, and more.
The content of this article is for information purposes only and is not investment advice or any form of recommendation or invitation. Luno always advises you to obtain your own independent financial advice before investing or trading in cryptocurrency.
All information is correct as of 10.00am SAST
Bitcoin price
We closed yesterday, 20 September, 2020, at a price of $10,938.27 – with a daily high of $11,095.87 and a low of $10,814.48.
That’s down from a closing price of $11,094.35 the day before. On the same day last year, one bitcoin would have set you back $10,019.72.
We’re 54.4% below bitcoin‘s all-time high of $20,089 (17 December 2017).
Bitcoin volume
The volume traded yesterday was $24,699,523,788 – up from $22,764,204,008 the day before.
Market capitalisation
Bitcoin’s market capitalisation as of yesterday was $202,308,927,892, down from $205,185,696,336 the day before. To put that into context, Jeff Bezos is now worth $184.9 billion after tech stocks plunged recently. This means he can only afford to buy 91.1% of all bitcoin. Better luck next time, Jeff.
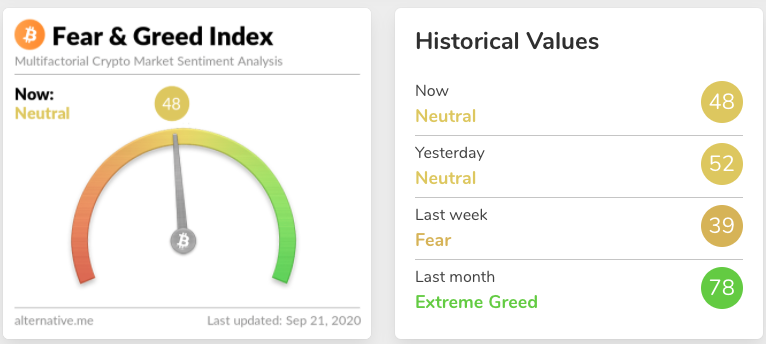
Fear and Greed Index
With more upwards price action, sentiment is down from 52 to a neutral 48 – moving out of the fear zone seen last week.
Extreme fear can be a sign that investors are too worried, which could be a buying opportunity. When Investors are getting too greedy, that means the market may be due for a correction.
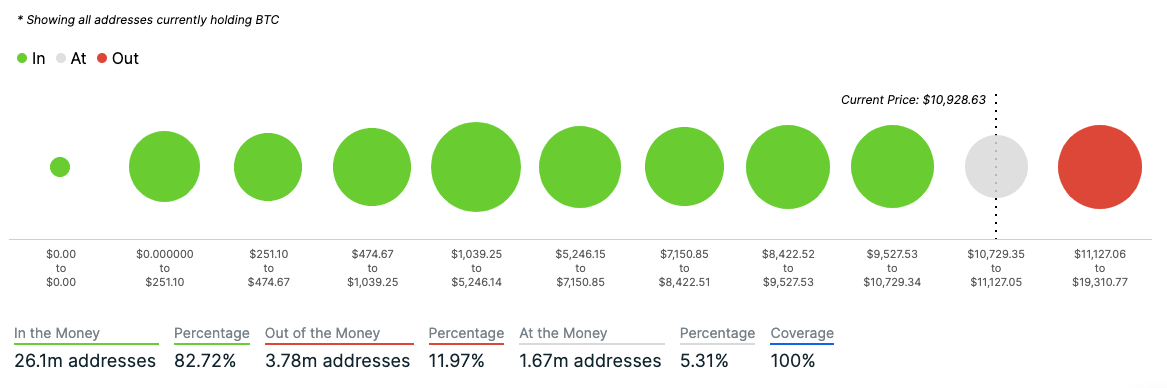
Global In/Out of the money
For any address with a balance of tokens, ITB identifies the average price (cost) at which those tokens were purchased and compares it with the current price. If the current price is higher than average cost, address is ‘In the Money’. If the current price is lower than the average cost, the address is ‘Out of the Money’.
Volatility
Annualised price volatility using 365 days.
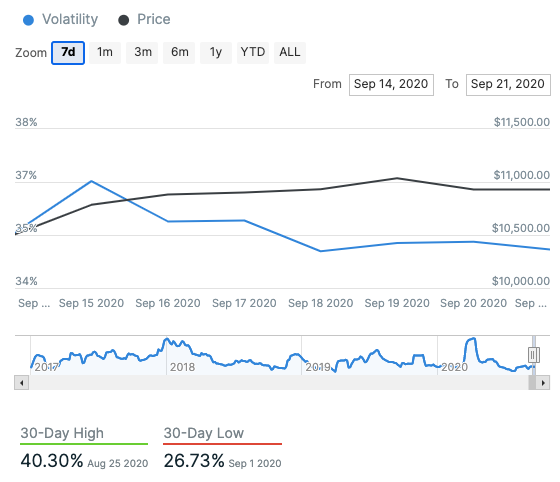
Chart courtesy of IntoTheBlock.com.
Bitcoin’s market dominance
Bitcoin’s market dominance stands at 61.15. Its lowest recorded dominance was 37.09 on 8 January, 2018.
Relative Strength Index (RSI)
The daily RSI is currently 51.15. Values of 70 or above indicate that an asset is becoming overbought and may be primed for a trend reversal or experience correction in price – an RSI reading of 30 or below indicates an oversold or undervalued condition.
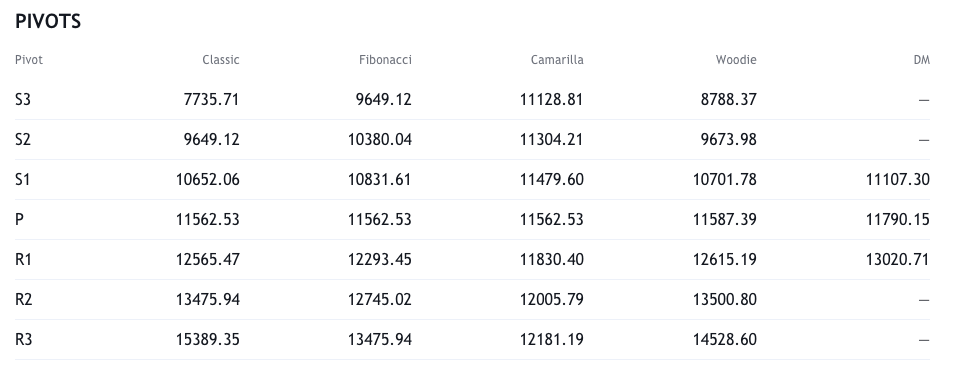
Resistance and support
What they said over the weekend…
Everyone should own $BTC, in case of hyperinflation.
They should also hold cash, in case of deflation.
The wealthiest people in history are the ones who had cash to buy everything when prices were depressed.
— The Wolf Of All Streets (@scottmelker) September 19, 2020
% of world using the Internet in 1995 = 0.5%
% of world using the Internet in 2020 = 60%% of world using Bitcoin in 2020 = 0.5%⁰⁰
What do you think the price will be when 60% of the population is using Bitcoin?
— Dan Held (@danheld) September 18, 2020
But I thought criminals use #Bitcoin? https://t.co/zHoRO1KN2c
— Lina Seiche (@LinaSeiche) September 20, 2020
The top 5 banks and their dodgy $$ volume implicated in the fincen papers:
Deutsche Bank – $1.3 trillion
JPMorgan Chase – $514 billion
Standard Chartered – $166 billion
Bank of New York Mellon – $64 billion
Barclays – $21 billionTell me again how Bitcoin is used by criminals?
— KING CO฿IE (@CryptoCobain) September 21, 2020
What other data points would you like to see covered in our Daily Report? Let us know on Twitter.
Did you find this useful?