Luno’s market analysis: 2020 H1 in review

Welcome to this week’s retrospective of the latest goings-on in the crypto markets, featuring an overview of price movements, a look at the fundamentals, and the impact of other major events over the last week. The content of this article is for information purposes only and is not investment advice or any form of recommendation or invitation. Luno always advises you to obtain your own independent financial advice before investing or trading in cryptocurrency.
We’re now more than halfway through 2020, giving us a great opportunity to indulge in a spell of reflection on the year so far. And it’s been eventful, to say the least.
It started with widespread optimism, as the largest cryptocurrencies kicked things off with a green candle month in January. This carried into February, with the price hitting a high for the year-to-date of $10,500 before a slight drop off. Then came COVID-19, which initiated a deep market crash and offset the entire growth seen prior to March.
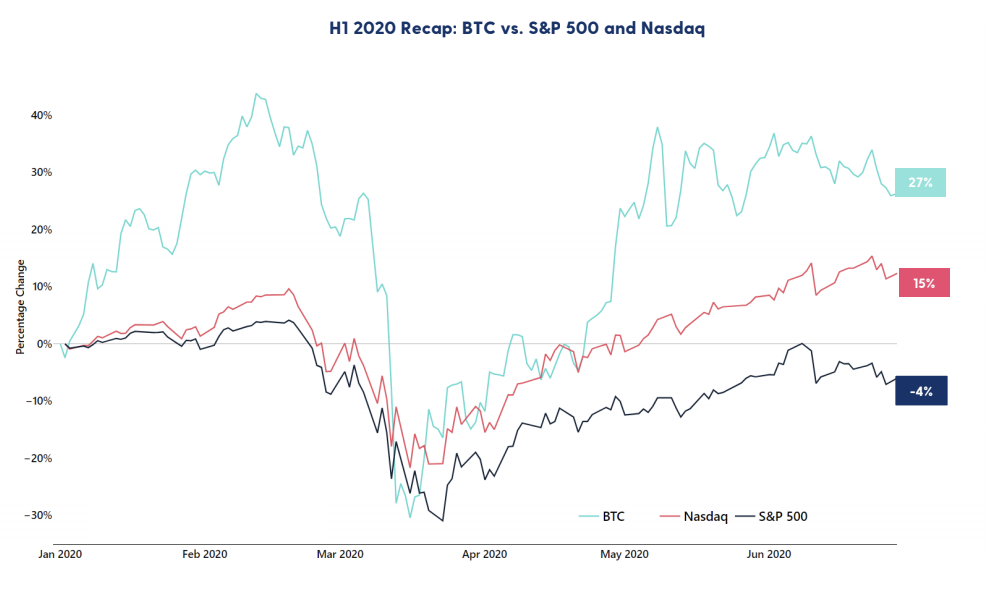
We’ve bounced back since then, though. Bitcoin is up 27% and has now outperformed the stock market so far this year. The top 3 cryptocurrencies by market capitalisation are mostly in the green – the exception being XRP, which has struggled so far this year and is down 9%. Ether (ETH) is the best performer, up 75% so far in 2020.
The recovery has, however, stagnated in recent weeks, with the price ranging largely between $9,000 and $9,800 since early May. Which is where we are today.
Price analysis
Short-term view
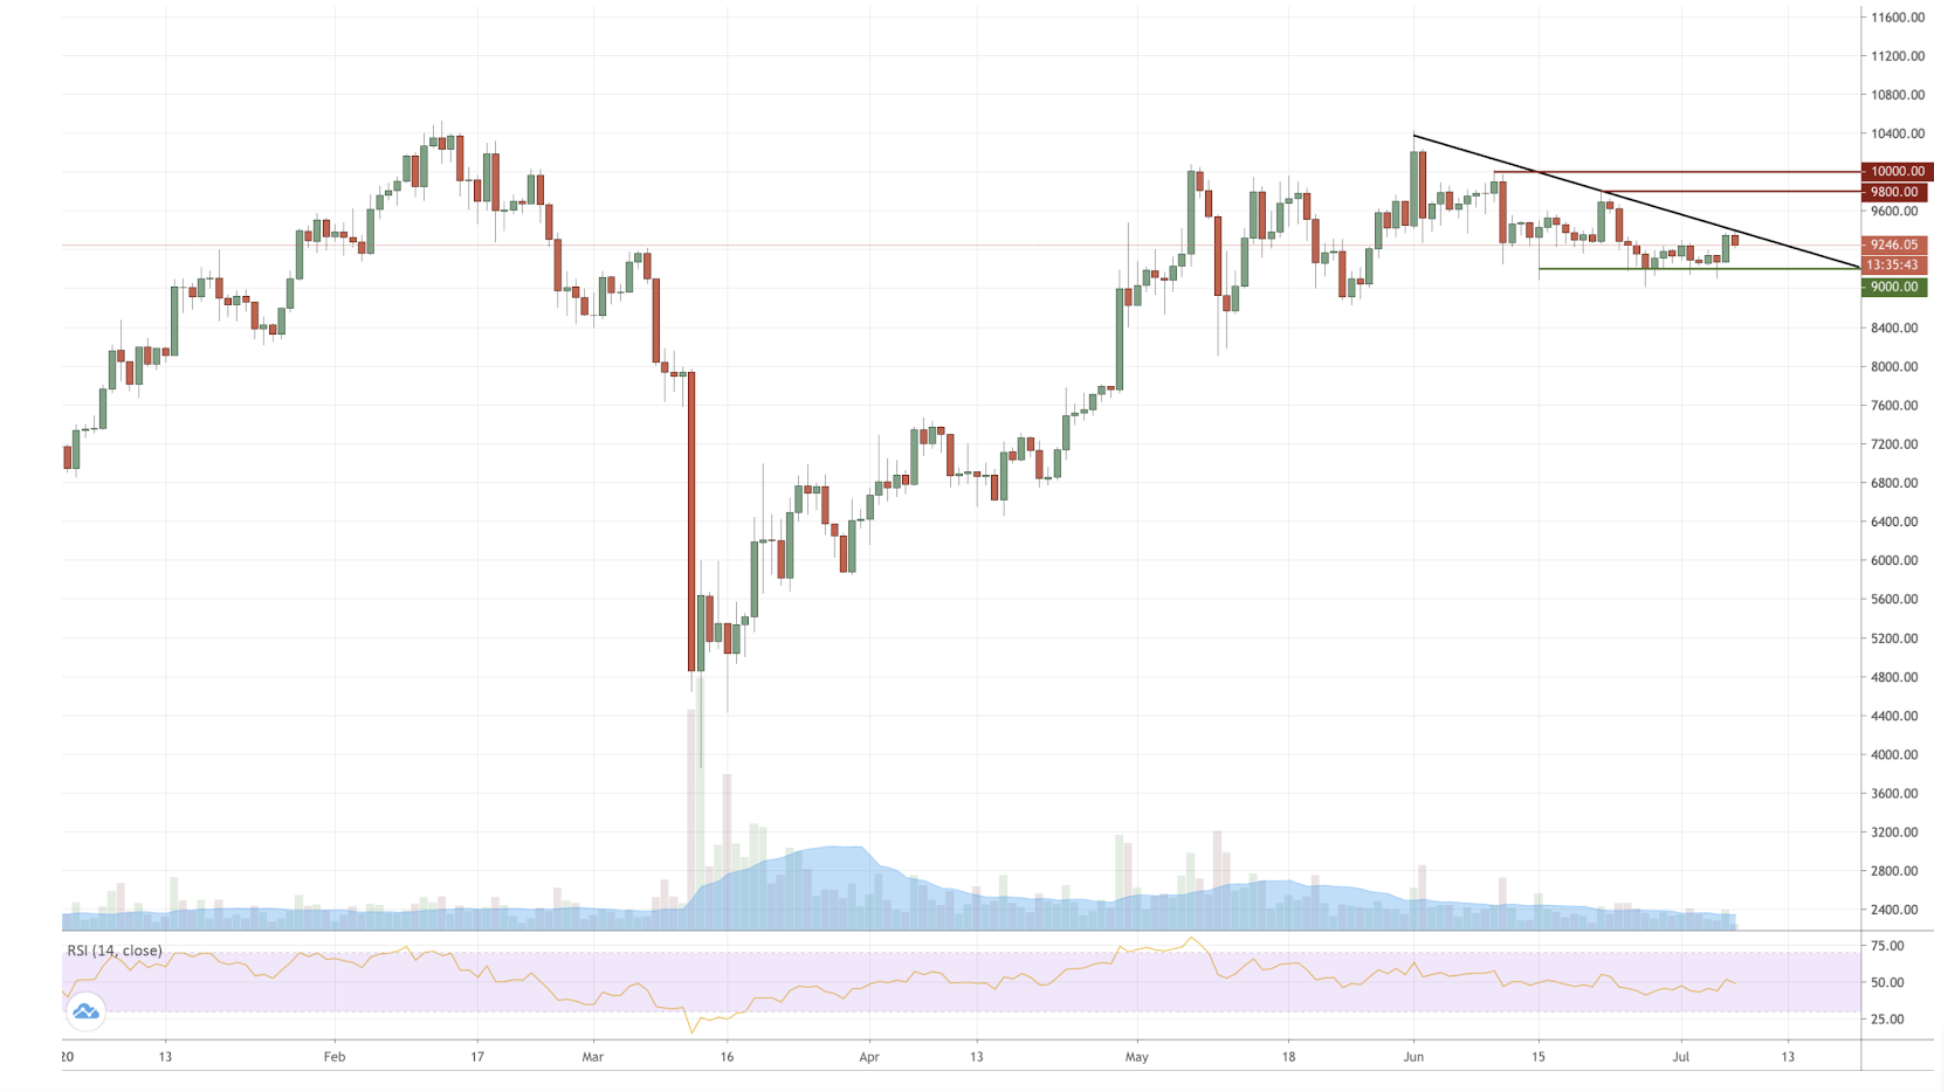
After more than a week of range-bound sideways price action, Monday finally saw BTC break out of its short term $9,000 to $9,300 channel to close at $9,400 – its biggest price jump since 25 June. However, while it may have made for exciting visual stimulus on the day, trading volumes have unfortunately not followed suit. As a result, there was a small subsequent retrace to the previously mentioned $9,300 resistance zone. This has helped to solidify the formation of a descending triangle pattern that began taking shape from the 1 June this year.
In terms of support, $9,000 has been significantly strengthened in recent weeks. It’s now a critical zone to watch out for if the price doesn’t continue its upward momentum. On the flip side, to maintain a push towards the $10,000 psychological barrier, BTC has a number of smaller resistance zones to overcome – though it will need more significant trading volumes for this to be sustained and a breakout above the downward trend line shown in black on the chart.
Long-term view
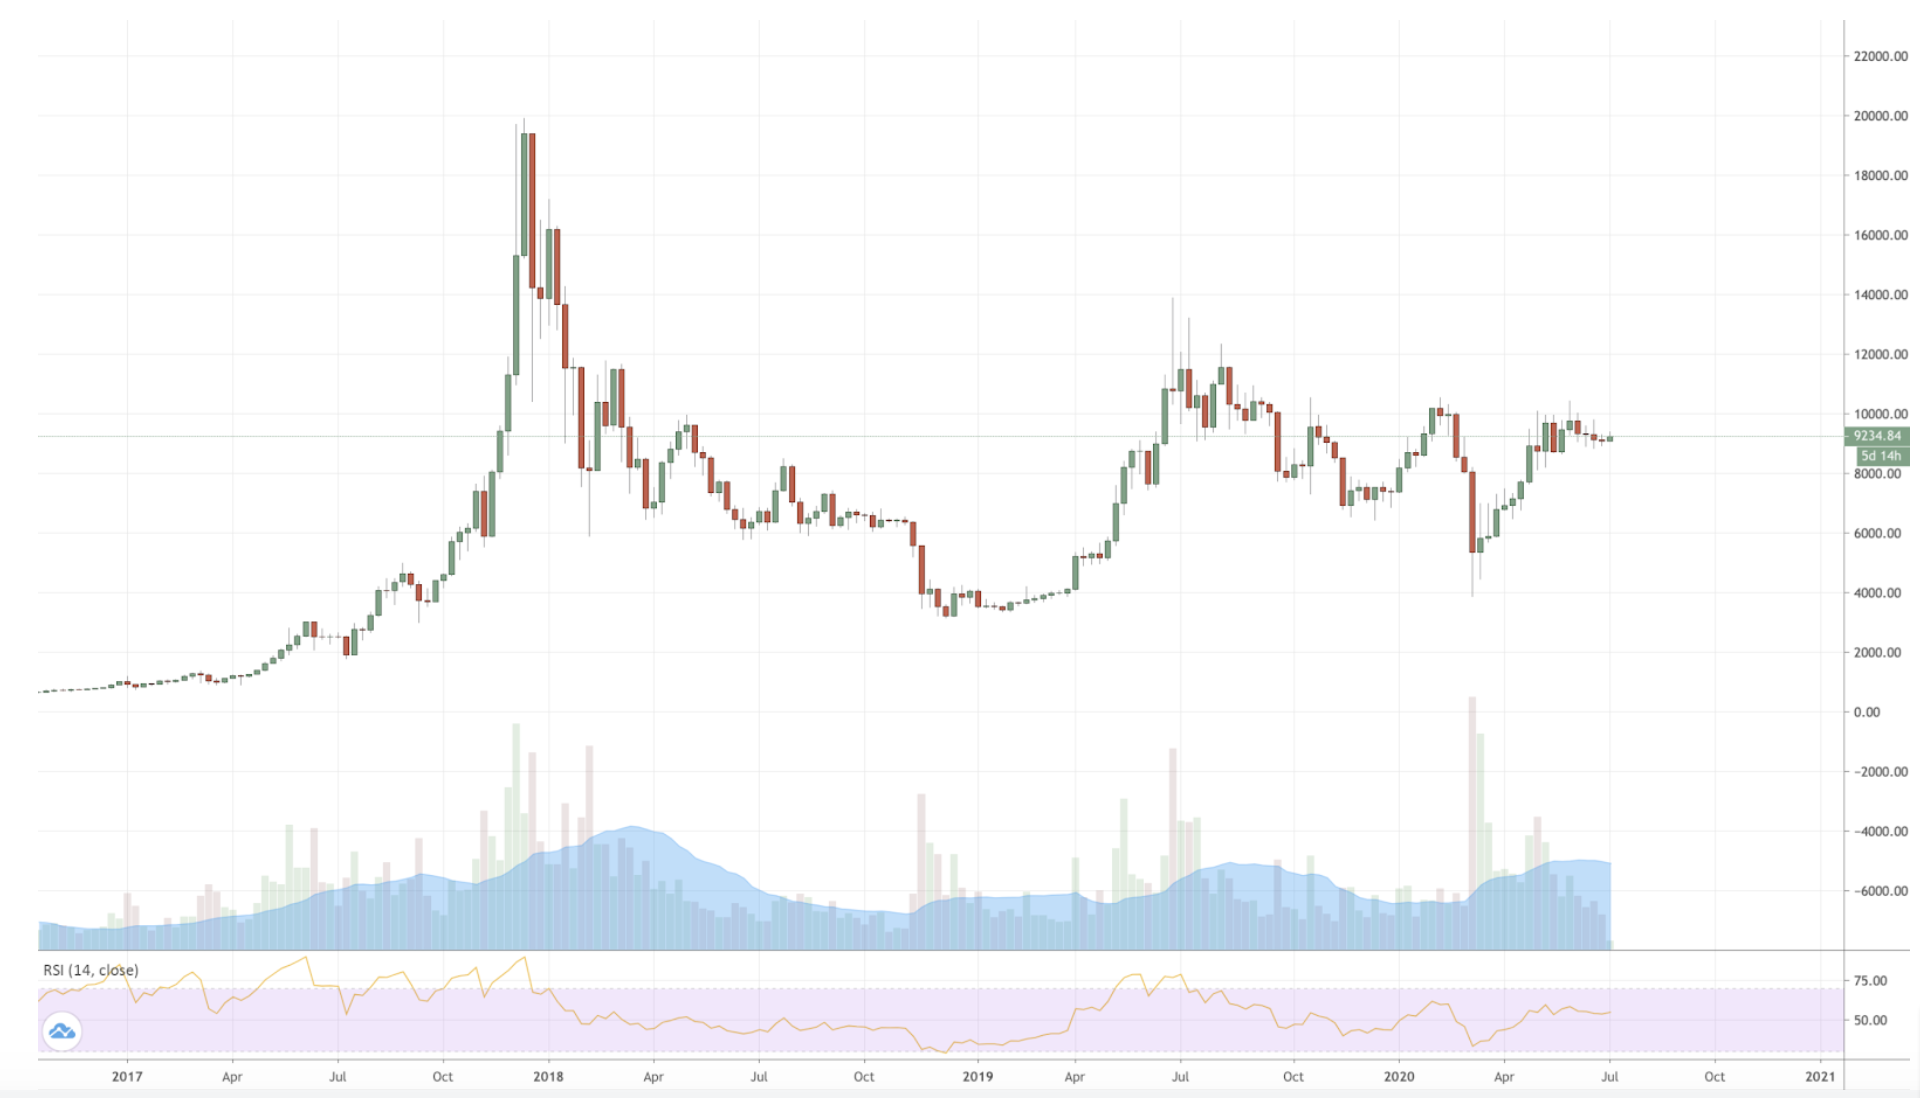
At a more macro level, we see BTC reaching and maintaining a phase of relative uncertainty, where after its strong recovery from the COVID-19 price shock, there has been largely limited weekly volatility and volumes within a tight range-bound zone. However, long-term lack of volatility is not something we are used to with BTC, and, given the current socio-economic environment being what it is, we would certainly not be surprised to see some more decisive price action in the near term.
Reasons to be cheerful
Bitcoin has outperformed the stock market so far this year. The strong recovery since mid-March has taken the price all the way back to levels last seen in February this year. Ever-expanding monetary policy has also served to galvanise many of cryptocurrency’s biggest supporters. Equally though, many believe that Bitcoin’s role has been more as an inflation hedge than a safe haven, pointing to its abnormally-high correlation to the stock market during the stock market sell-off.
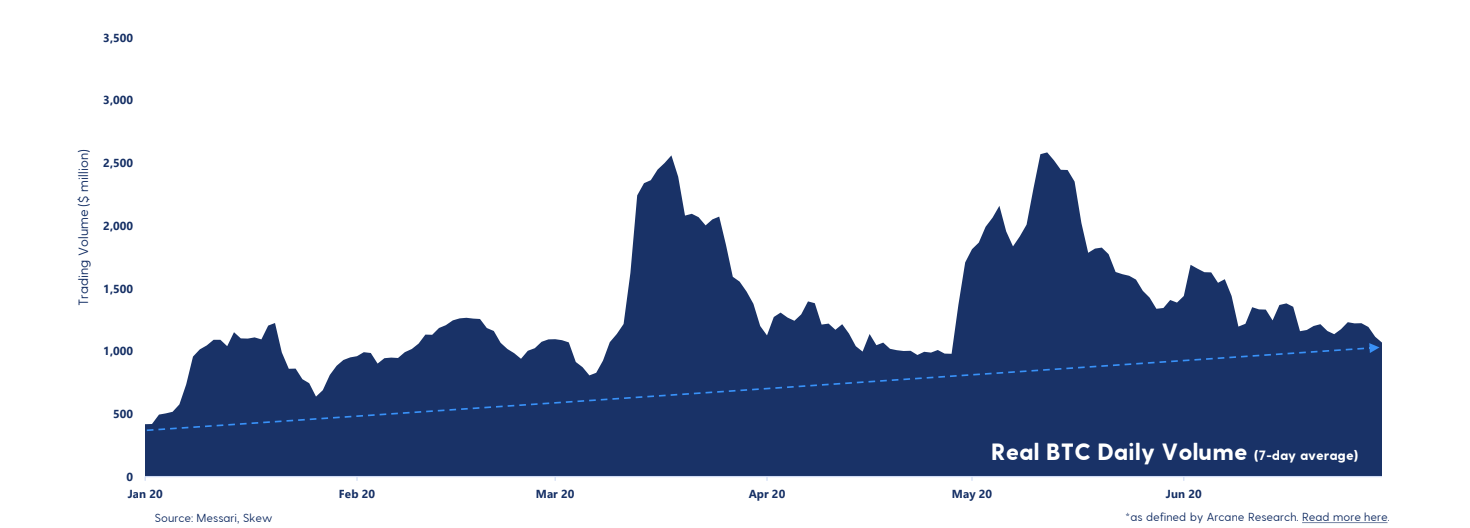
Bitcoin volume slowly trending upwards this year
The 7-day average real trading volume has been trending downwards since Bitcoin reached $10,000 again at the beginning of May. The trend for the first half of 2020 has still been upwards, but there is no certainty in this trend continuing as the market has been unusually relaxed lately. The second half of 2020 may be characterised by decreasing volume, as we saw in 2019 after the summer months.
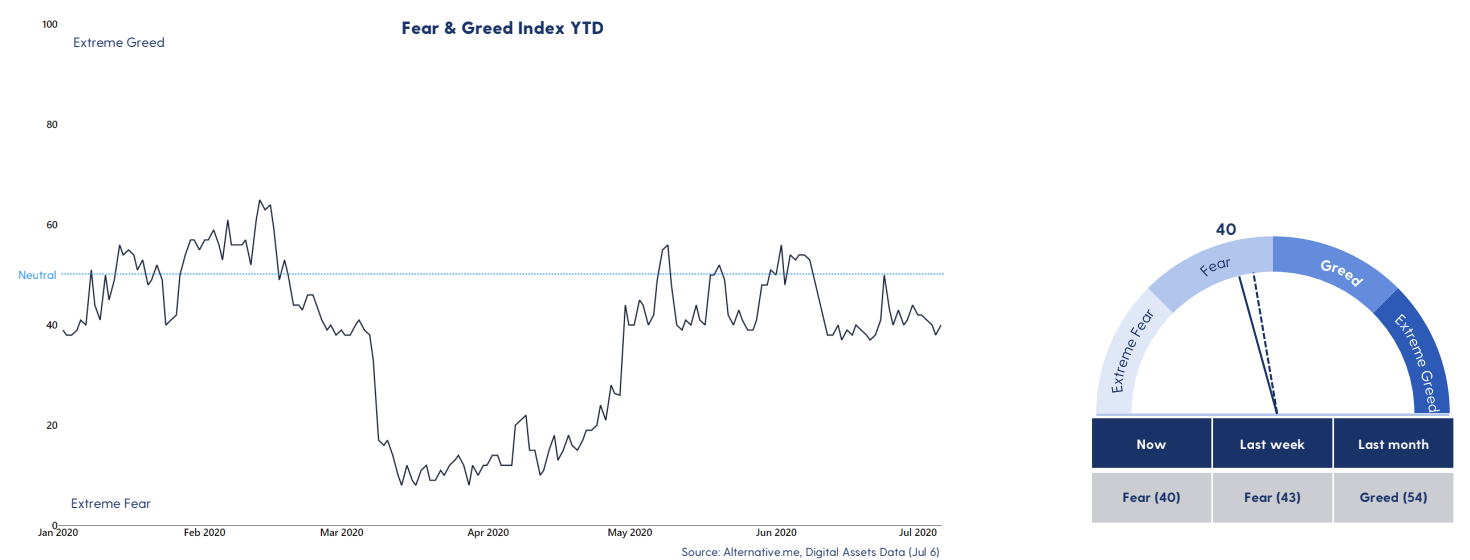
The market has been fearful so far this year
If we look back at the first half of 2020 from a market sentiment perspective, the trend is clear. Except for a longer period in February and a few spikes in May, the market sentiment has stayed below neutral and in the fearful area this year. Less than 25% of the first half has been in a greedy state, which gives a good summary of the year so far: Uncertainty and fear have been highly present.
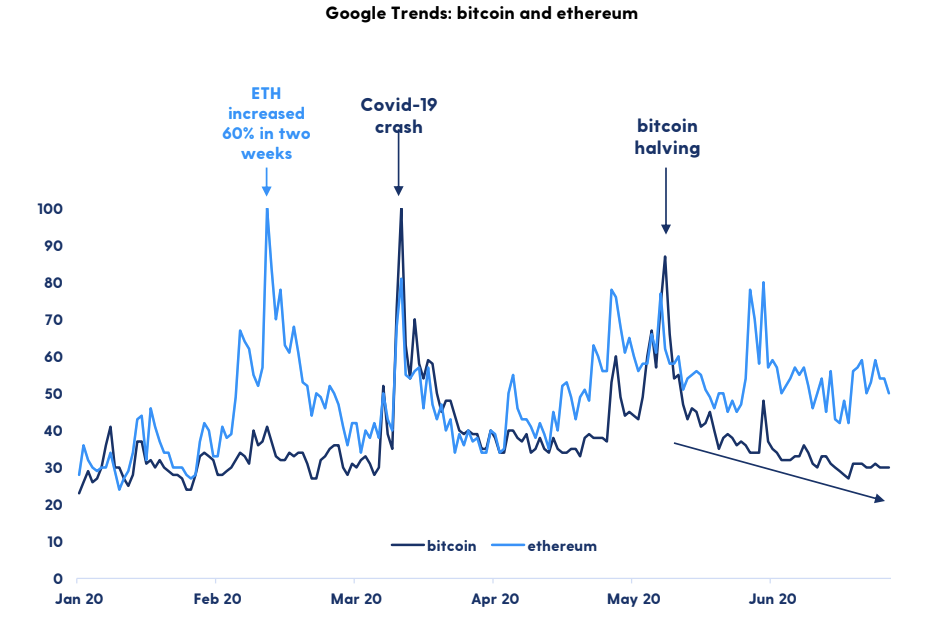
Different hype periods for Bitcoin and Ethereum this year
Search trends from Google show that Bitcoin and Ethereum have had two different hype periods during the first half of 2020. While the search interest for bitcoin was highest when the market crashed in March, Ethereum’s search interest peaked mid- February, when the ETH price increased rapidly. Bitcoin saw another hype period when the halving took place in May, but could not surpass the levels from March.
It is interesting to note that the search interest for Ethereum has remained fairly high after the market recovered and throughout the second quarter of 2020. This might be linked to increased interest around DeFi. On the other hand, bitcoin’s search interest has dropped again after the halving in May and ended the first half of 2020 down to early March levels.
The year so far

In December last year, we made a few predictions as to what 2020 had in store for crypto. We took a look back at what we got right and wrong, and what the rest of the year has in store.
READ HERE
Keep reading…
Luno’s market analysis – Week 26
 Discover
 Help Centre
 Status
 Company
 Careers
 Press
Press

