Discover
 Help Centre
 Status
 Company
 Careers
 Press
PressDaily market update: Bitcoin tests $14k as US election hangs in balance

It’s now been more than 100 days since we last saw bitcoin price below $10,000 – a record streak. But are the days of 4-figure bitcoin really in the rear-view mirror for good now? We may find out in the coming days, as it’s testing times for the markets. The US election still hangs in the balance at time of writing, while economies around the world are closing down yet again in the face of rising COVID-19 cases. Which way will it all go?
Here’s your daily look at the latest bitcoin market movement. If you’re new to the world of crypto trading, take a look through our beginner’s guide to crypto trading series, starring in-depth explorations of common strategies, market analysis techniques, and more.
The content of this article is for information purposes only and is not investment advice or any form of recommendation or invitation. Luno always advises you to obtain your own independent financial advice before investing or trading in cryptocurrency.
All information is correct as of 08:00am GMT.
Bitcoin price
We closed yesterday, 3 November, 2020, at a price of $13,950.30 – up from 13,550.49 the day before and $13,271.29 a week ago. That’s the highest closing price since 13 January, 2018. We’ve now spent 11 consecutive daily closes above $13,000.
The daily high was $13,984.98, with bulls again testing $14,000 to no avail. The daily low was $13,325.44, which is the lowest daily low since 30 October.
We’re 30.56% below bitcoin‘s all-time high of $20,089 (17 December 2017).
As of today, buying bitcoin has been profitable for…
98.4% of all days since 2013-04-28.
Bitcoin volume
The volume traded yesterday was $29,869,951,617 – down from $30,771,455,468 the day before. High volume indicates that a significant price movement has stronger support and is more likely to be sustained.
Market capitalisation
Bitcoin’s market capitalisation as of yesterday was $258,541,441,764, up from $251,119,864,445 the day before. That’s Bitcoin’s highest market cap since 7 January, 2018.
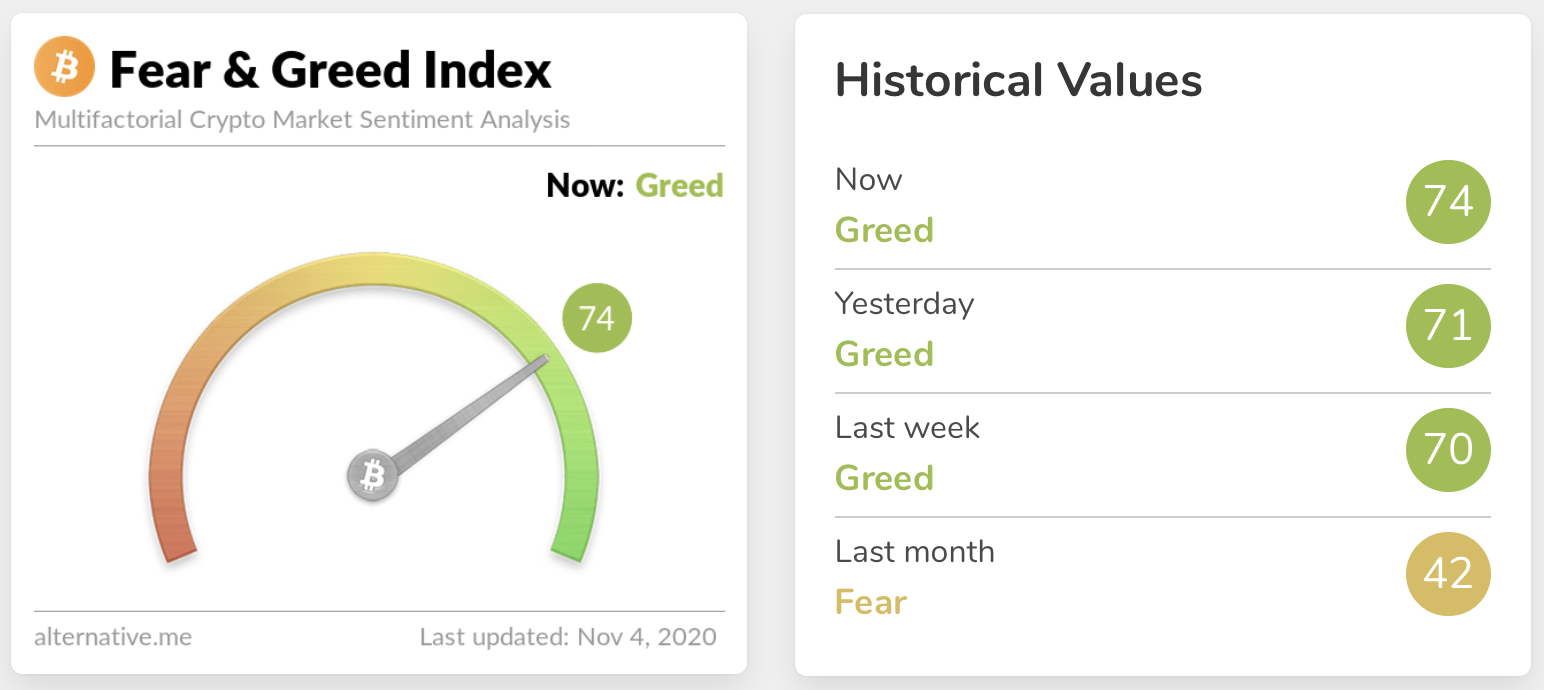
Fear and Greed Index
Sentiment is up at 74, having spent yesterday at 71. The last time we were below 70 was 29 October. Extreme fear can indicate that investors are getting too worried and there’s an opportunity for buyers, while extreme greed could mean the market is due for a correction.
Global In/Out of the money
For any address with a balance of tokens, ITB identifies the average price (cost) at which those tokens were purchased and compares it with the current price. If the current price is higher than average cost, address is ‘In the Money’. If the current price is lower than the average cost, the address is ‘Out of the Money’.
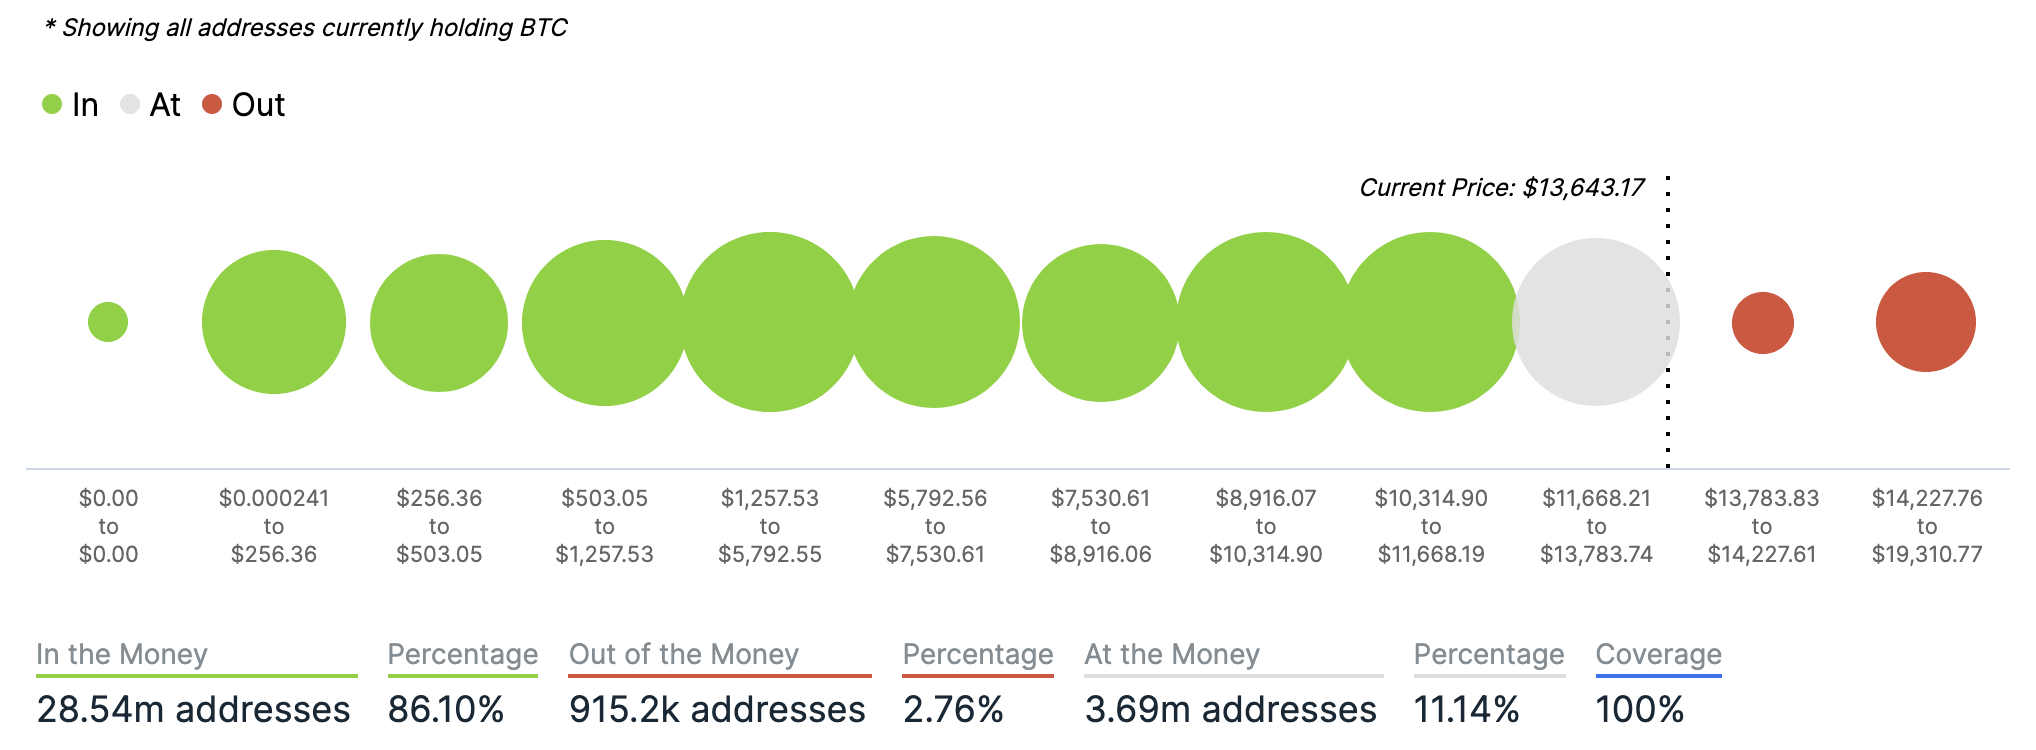
Chart provided by IntoTheBlock.com
Volatility
Annualised price volatility using 365 days.
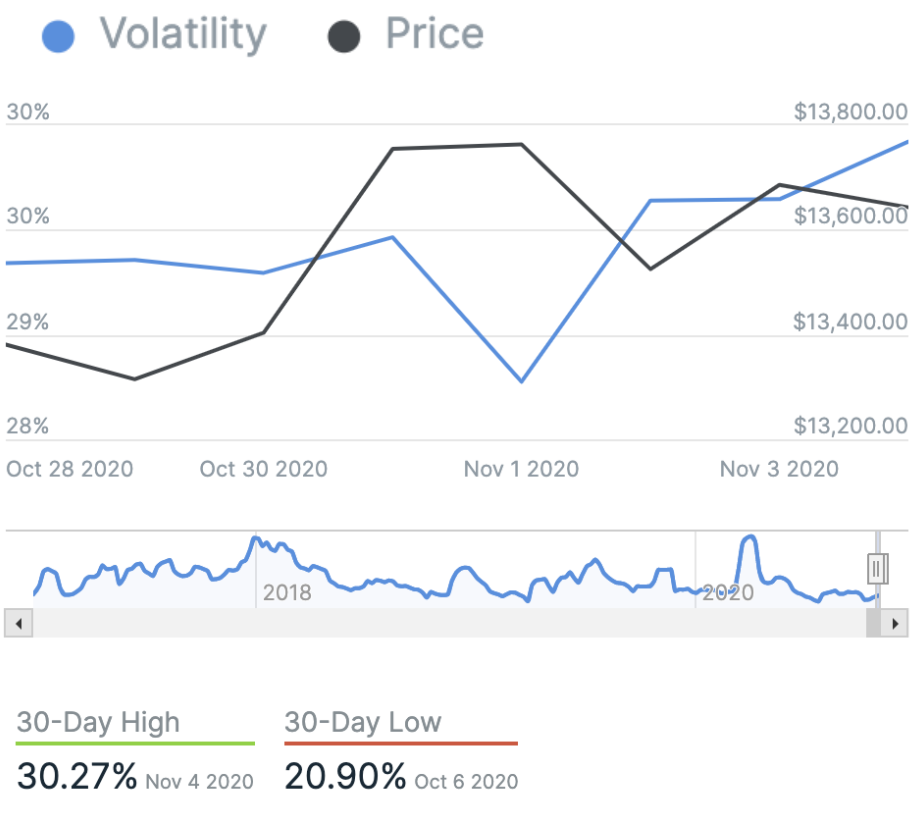
Chart provided by IntoTheBlock.com
Twitter sentiment
Yesterday, there were 12,194 tweets sent with a positive connotation towards bitcoin, 23,697 with a neutral connotation, and 1,849 were negative.
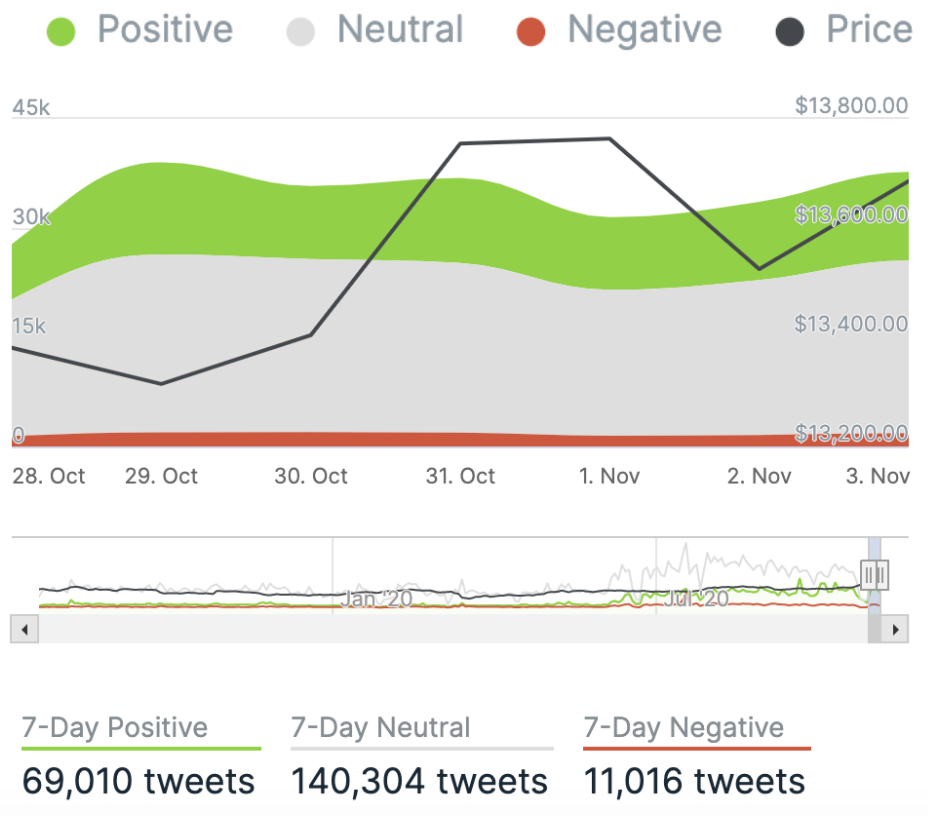
Chart provided by IntoTheBlock.com
Bitcoin’s market dominance
Bitcoin’s market dominance stands at 64.62. Its lowest recorded dominance was 37.09 on 8 January, 2018.
Relative Strength Index (RSI)
The daily RSI is currently 65.15. Values of 70 or above indicate that an asset is becoming overbought and may be primed for a trend reversal or experience a correction in price – an RSI reading of 30 or below indicates an oversold or undervalued condition.
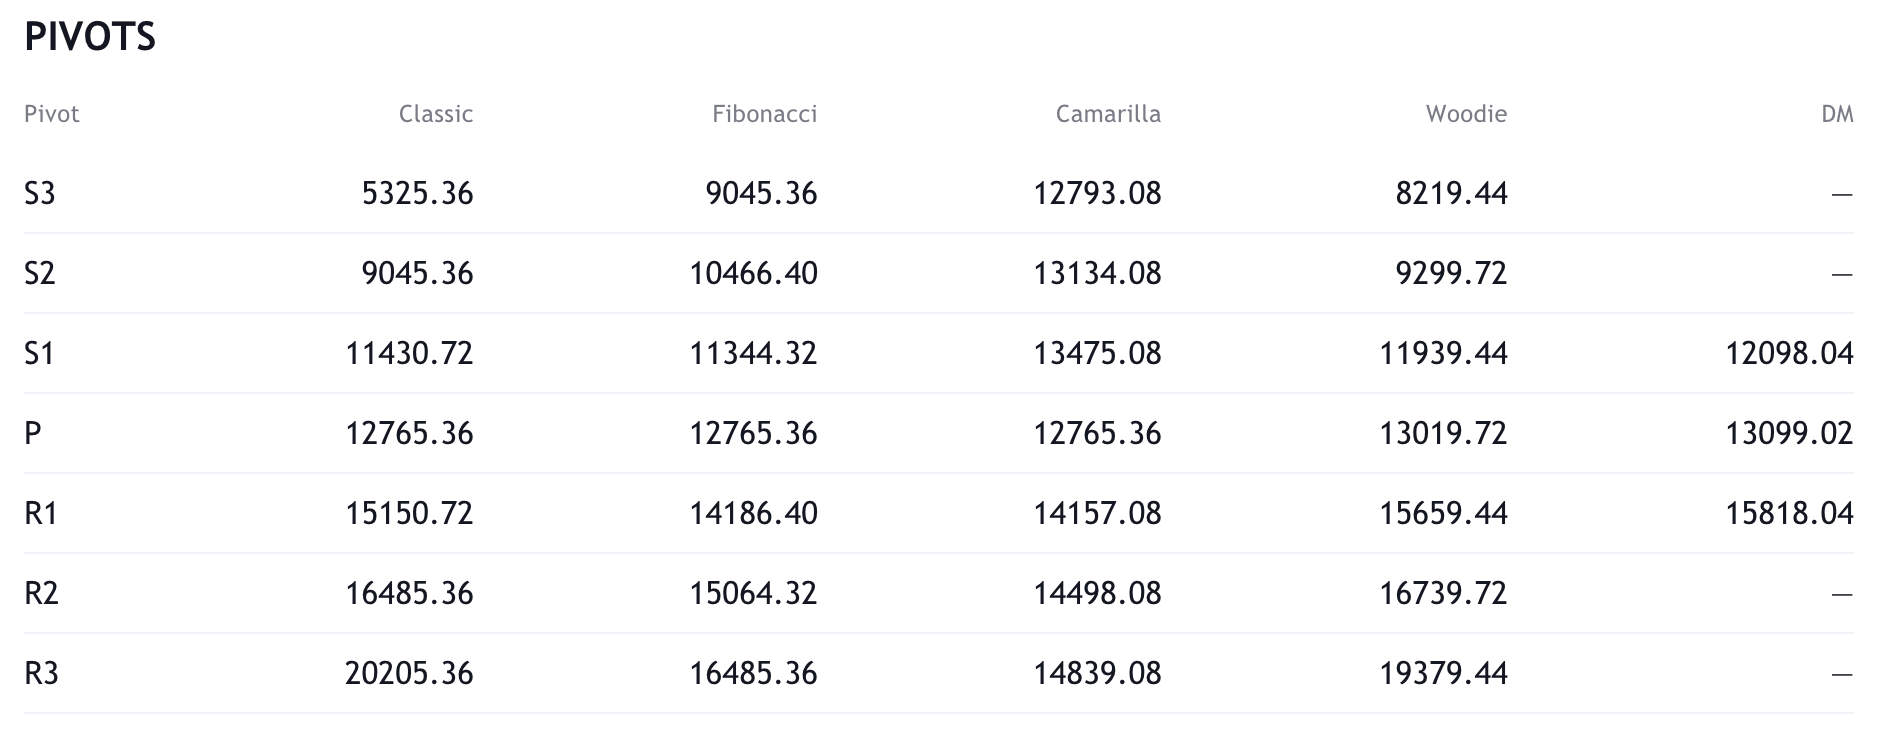
Resistance and support
What they said yesterday…
#Bitcoin will be the big winner tonight
— Tyler Winklevoss (@tyler) November 3, 2020
#Bitcoin for president
— Meltem Demirors (@Melt_Dem) November 3, 2020
Someone just moved almost $1 Billion in bitcoin (one of the biggest single transactions in BTC history) The most incredible thing is that the fee to do that…was $12. pic.twitter.com/ulV8qBbLrb
— Amber Kanwar (@amberkanwar) November 4, 2020
Someone just moved almost $1 Billion in bitcoin (one of the biggest single transactions in BTC history) The most incredible thing is that the fee to do that…was $12. pic.twitter.com/ulV8qBbLrb
— Amber Kanwar (@amberkanwar) November 4, 2020
“Bitcoin is dead”
“Ethereum is dead”
“ICOs are dead”
“DeFi is dead”… when you realize that none of these are true, you will enter the next level of the maze
— EllioTrades (@elliotrades) November 3, 2020
What other data points would you like to see covered in our Daily Report? Let us know on Twitter.
Did you find this useful?